Knowledge Graphs for Business: What They Are, How They Work, and Where They Help


Most business data lives as rows in tables or text in documents, which is fine until the question you need answered is about how things connect. Which customers are linked to this flagged account? Which contracts reference a vendor whose parent company just changed hands? Knowledge graphs for business answer those questions by storing your information as things and the relationships between them, so the connections become as queryable as the facts. For a business, and increasingly for the AI built on top of it, that turns a heap of disconnected records into something that can reason about how the pieces relate. This guide covers what knowledge graphs are, how they differ from a database and from the retrieval behind most AI, where they pay off, and how to build one.
A knowledge graph represents information as a network of entities and the relationships between them. Entities are the things: a customer, a product, a contract, a person, a place. Relationships are the links: this customer bought that product, this contract belongs to that vendor, this person works for that company. In graph terms, the entities are nodes and the relationships are edges, and together they form a web you can walk. The idea reached the mainstream on 16 May 2012. Google launched its own Knowledge Graph with more than 500 million objects and 3.5 billion facts about how they connect, and search results started answering questions instead of listing pages.
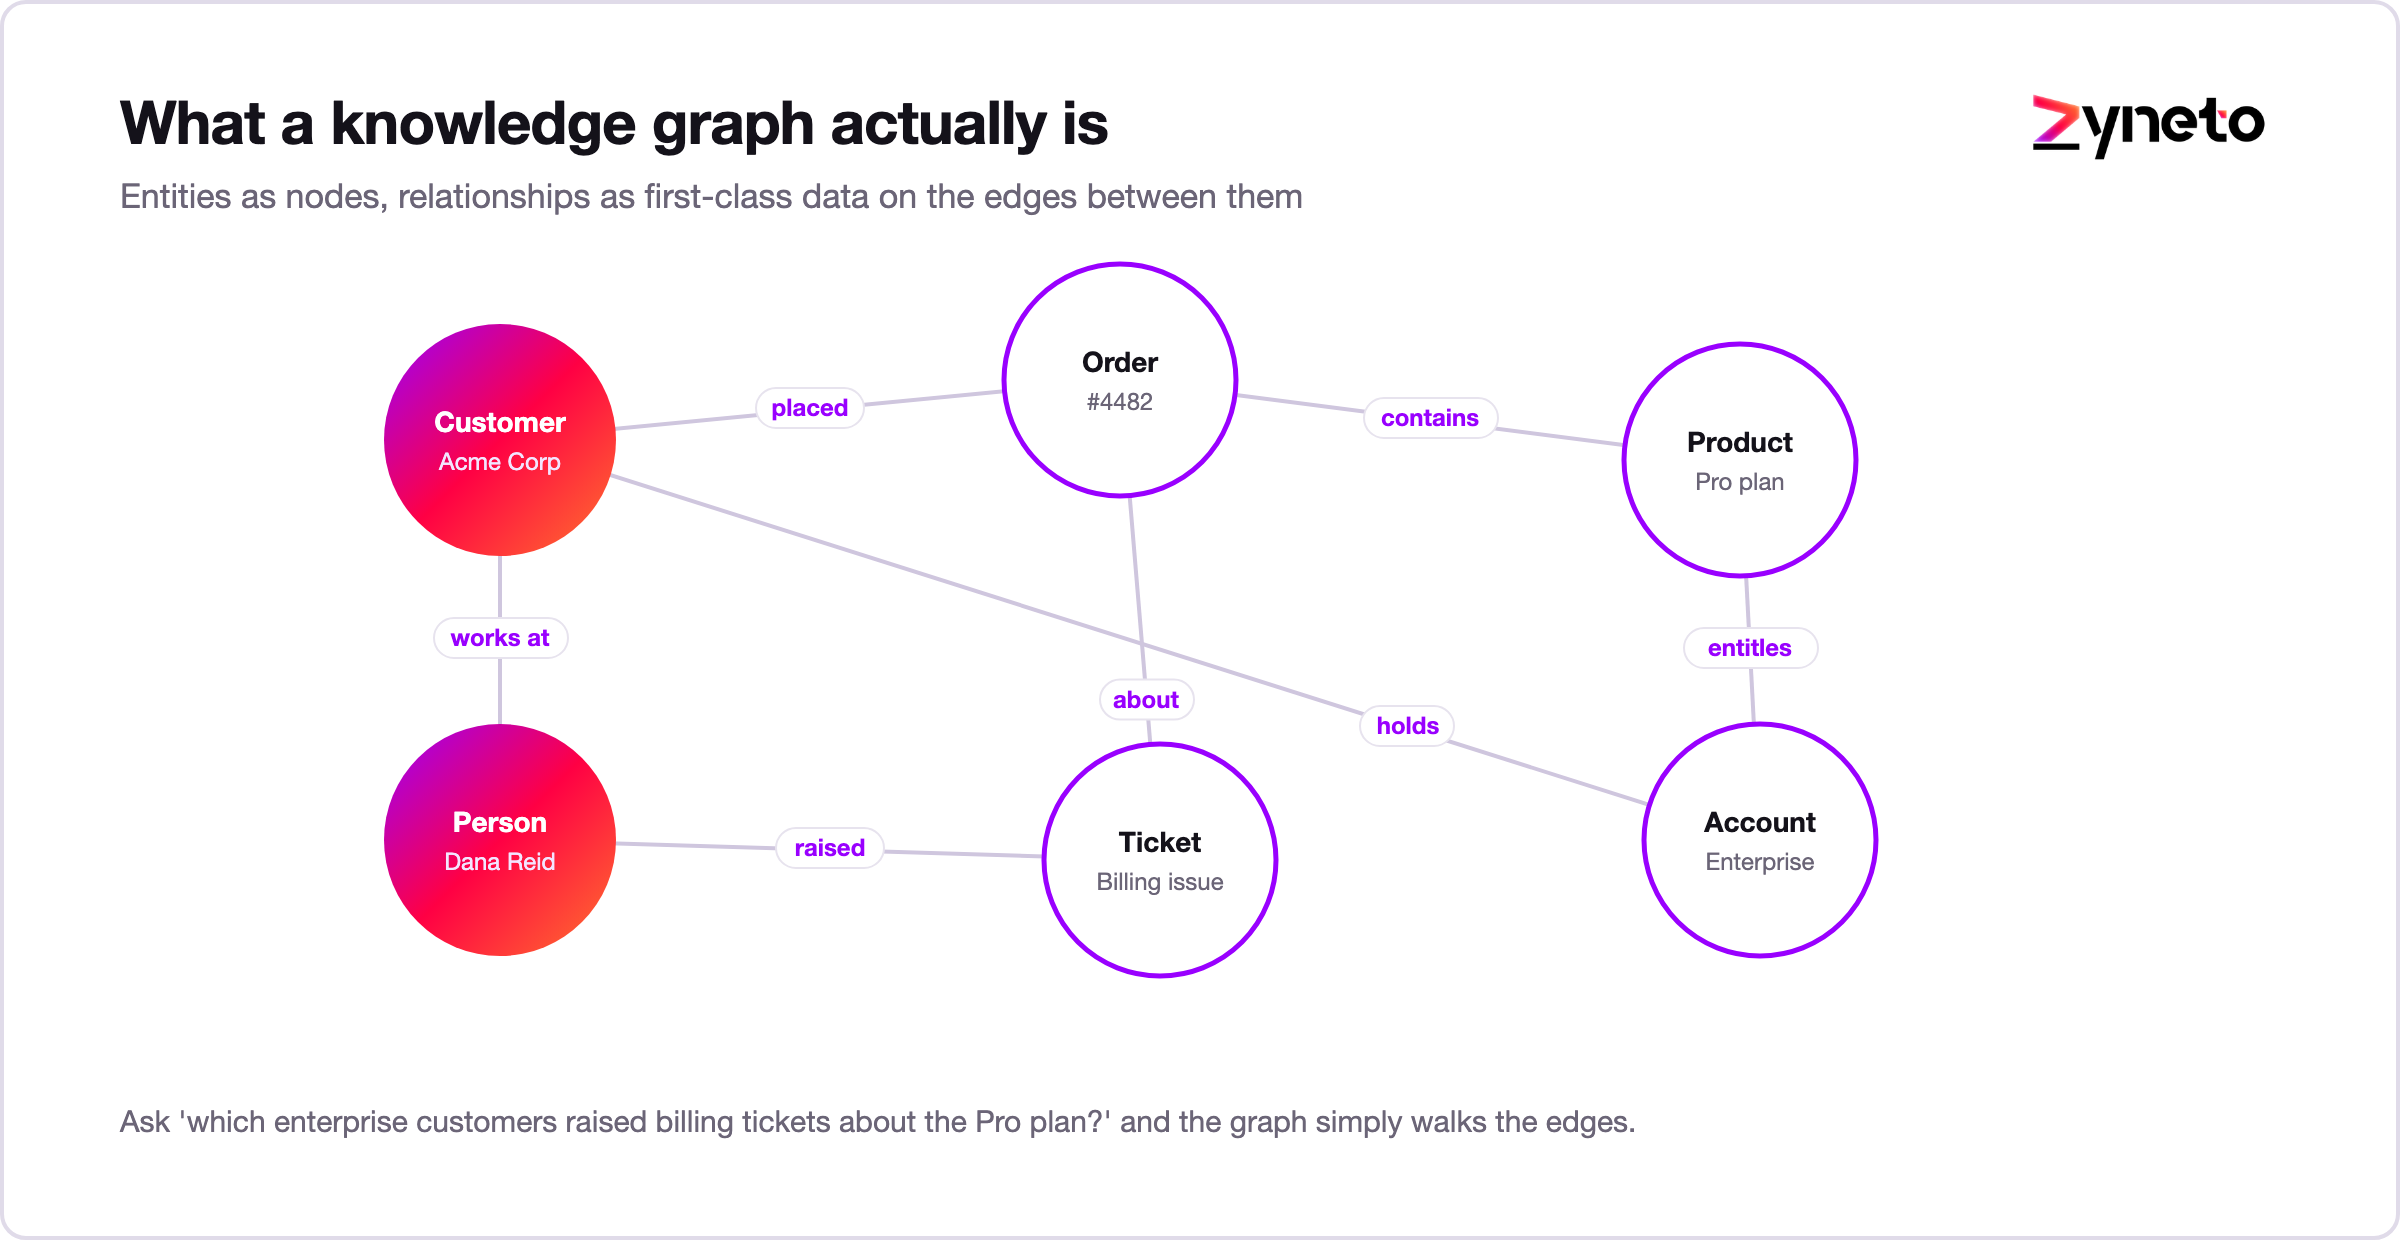
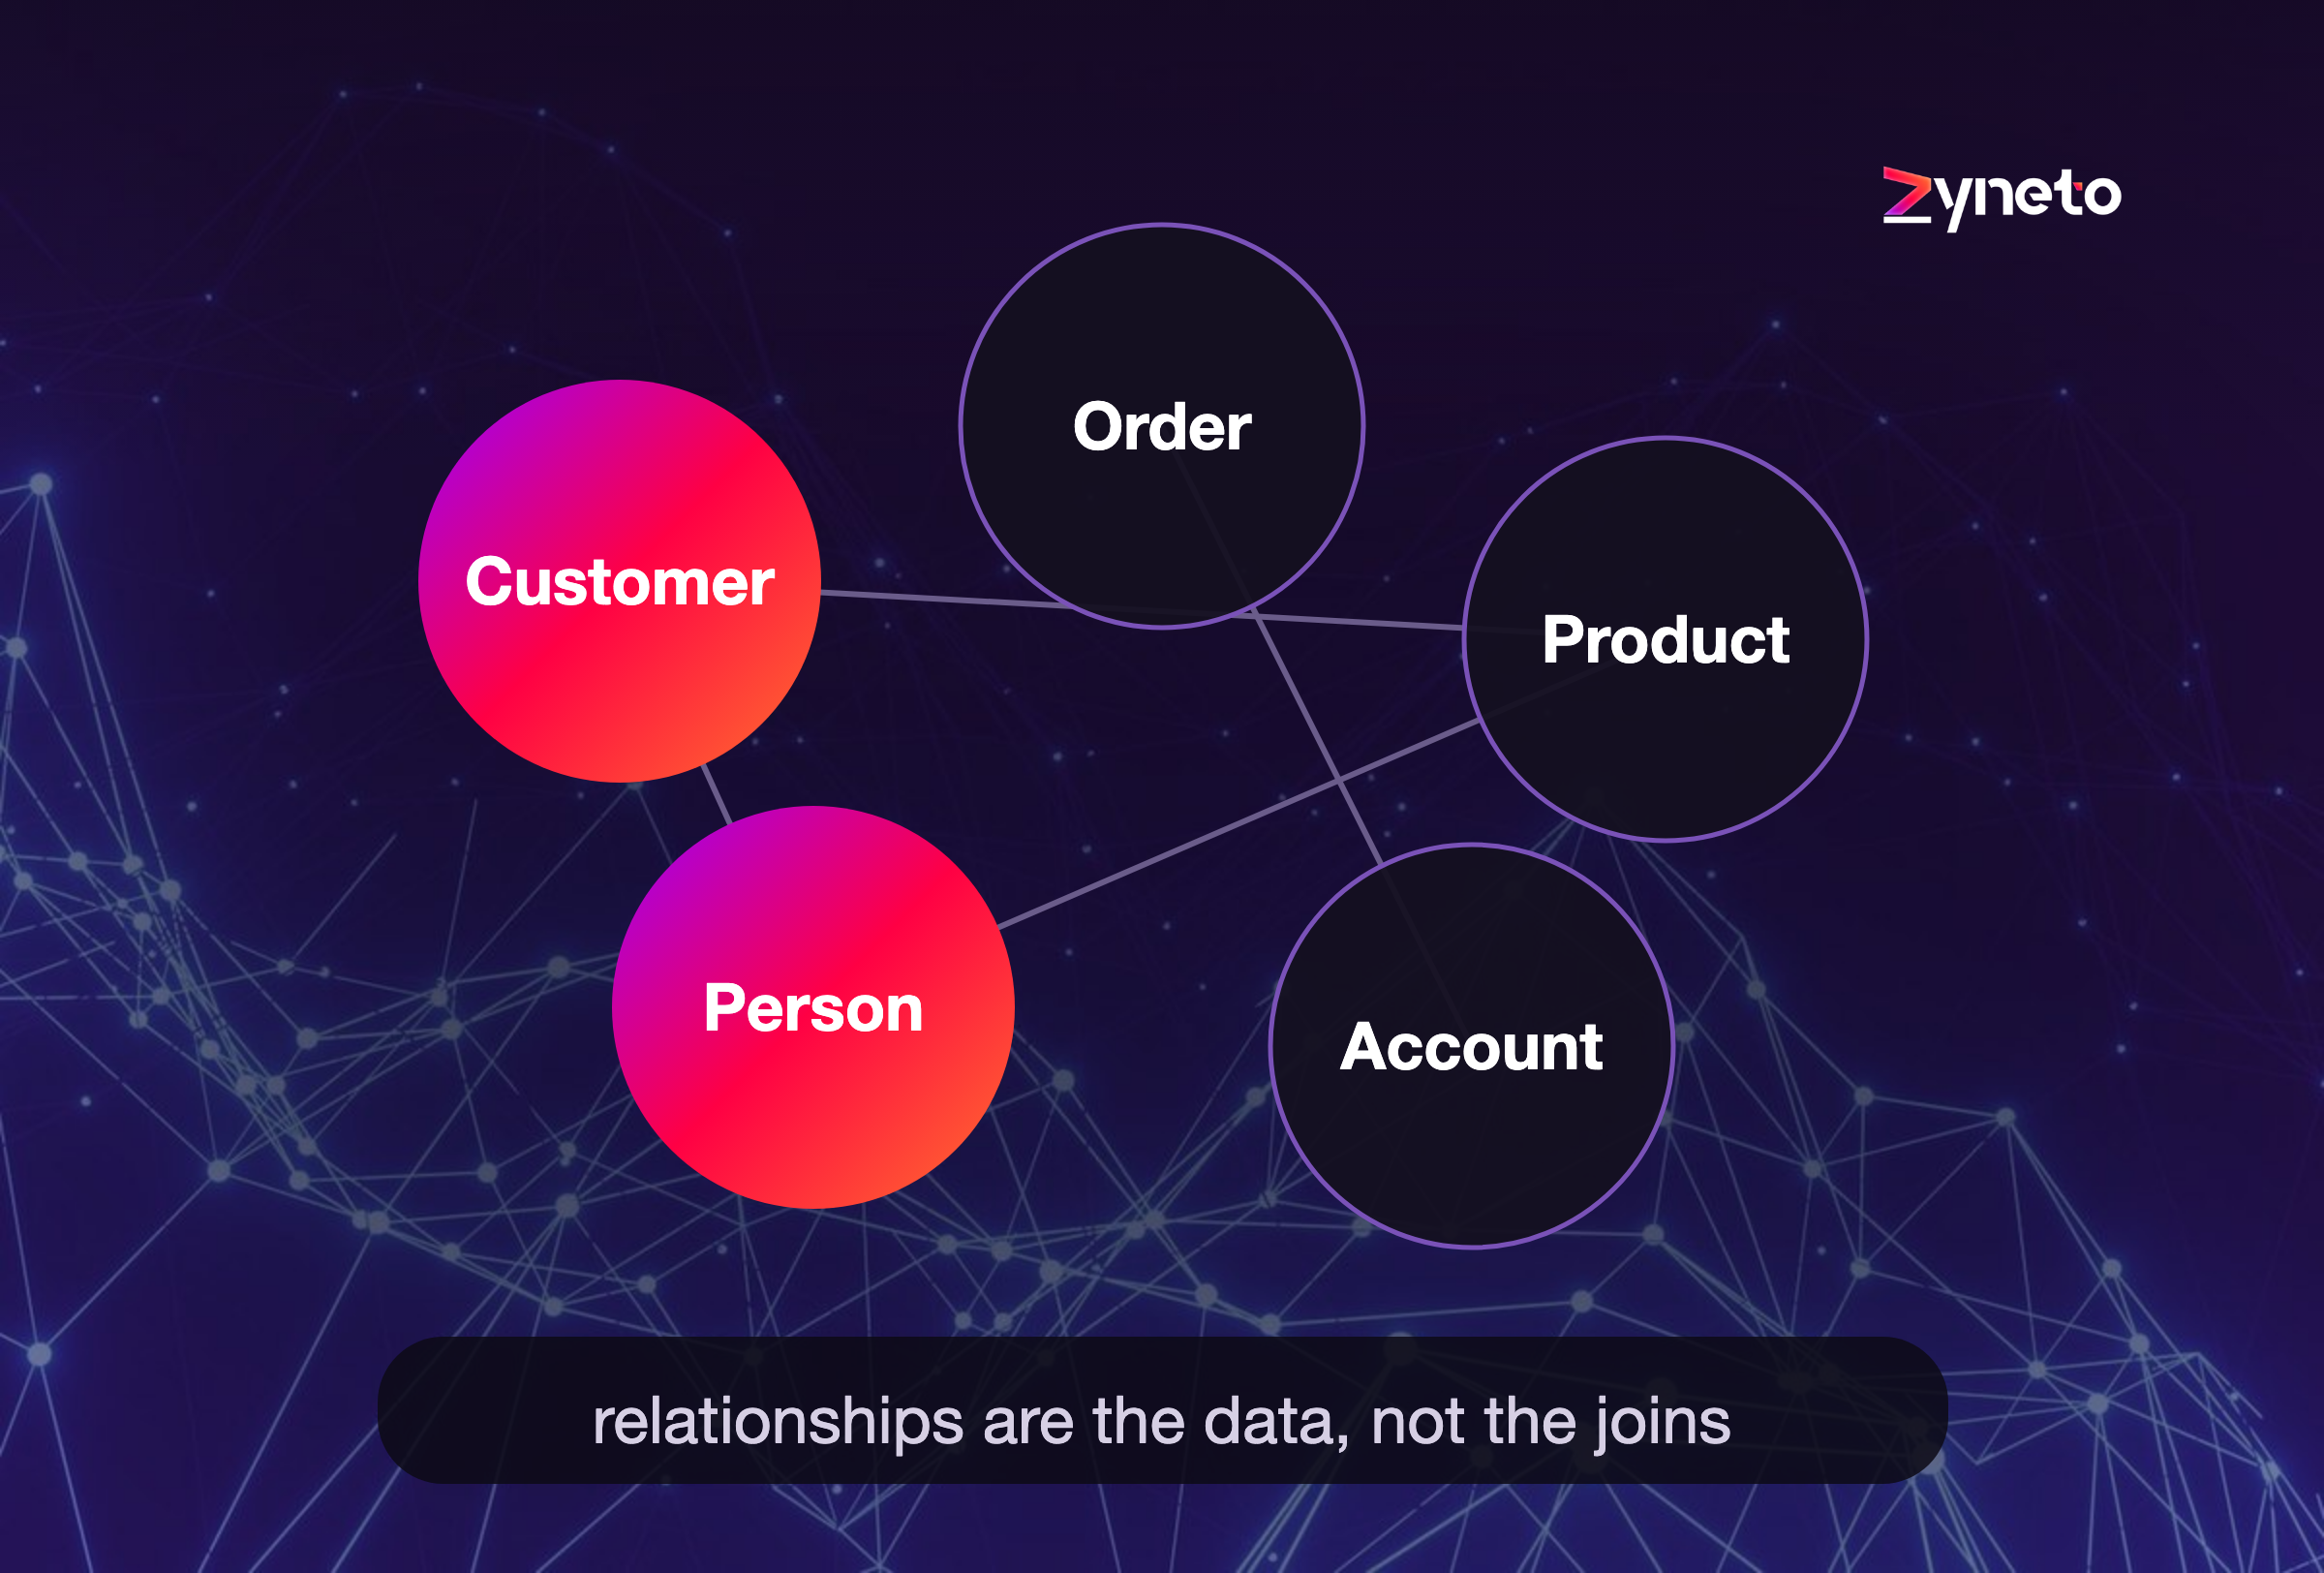
That is the whole idea, and it sounds simple because it is. The power comes from making relationships first-class citizens. In most systems, the connections between records are implied and awkward to query. In a knowledge graph, the connection is the data, sitting right next to the things it connects, which is exactly what you want when the question is about how things relate rather than what any single record says.
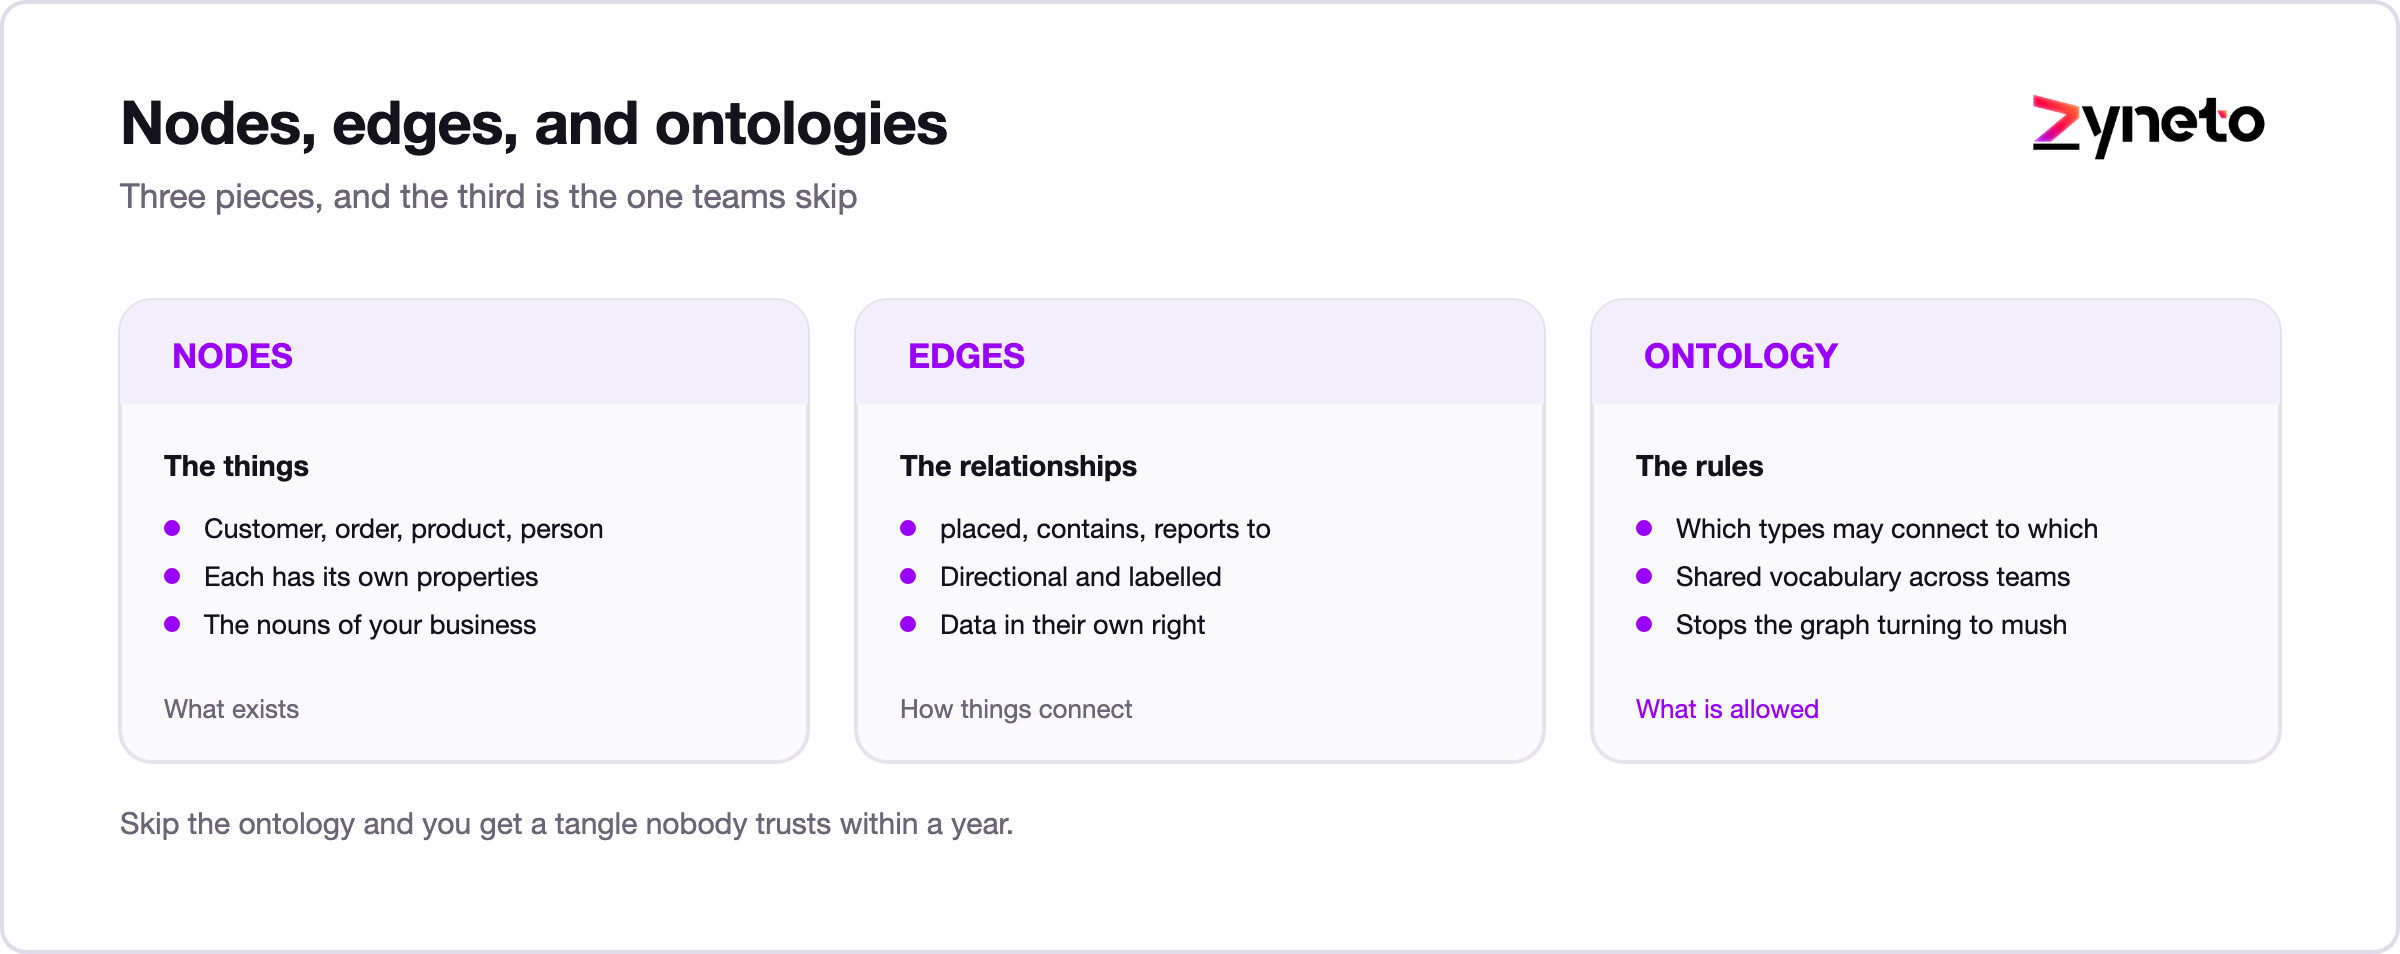
Push a little further and three ideas do most of the work. Nodes are the entities, and they carry properties, so a customer node holds a name, a signup date, a tier. Edges are the relationships, and they carry properties too, so a "purchased" edge can hold the date and the amount, which means the connection itself is rich, not just a line between two dots. And the ontology is the rulebook: it says a customer can purchase a product, a product belongs to a category, a person works for a company, defining the shapes your graph is allowed to take. A good ontology is what keeps a graph coherent as it grows. A missing one is how graphs quietly turn into spaghetti. You do not need to master the theory to sponsor a project, but knowing these three words helps you tell a thoughtful build from a shaky one.
It helps to set a knowledge graph next to the relational database most companies already run.
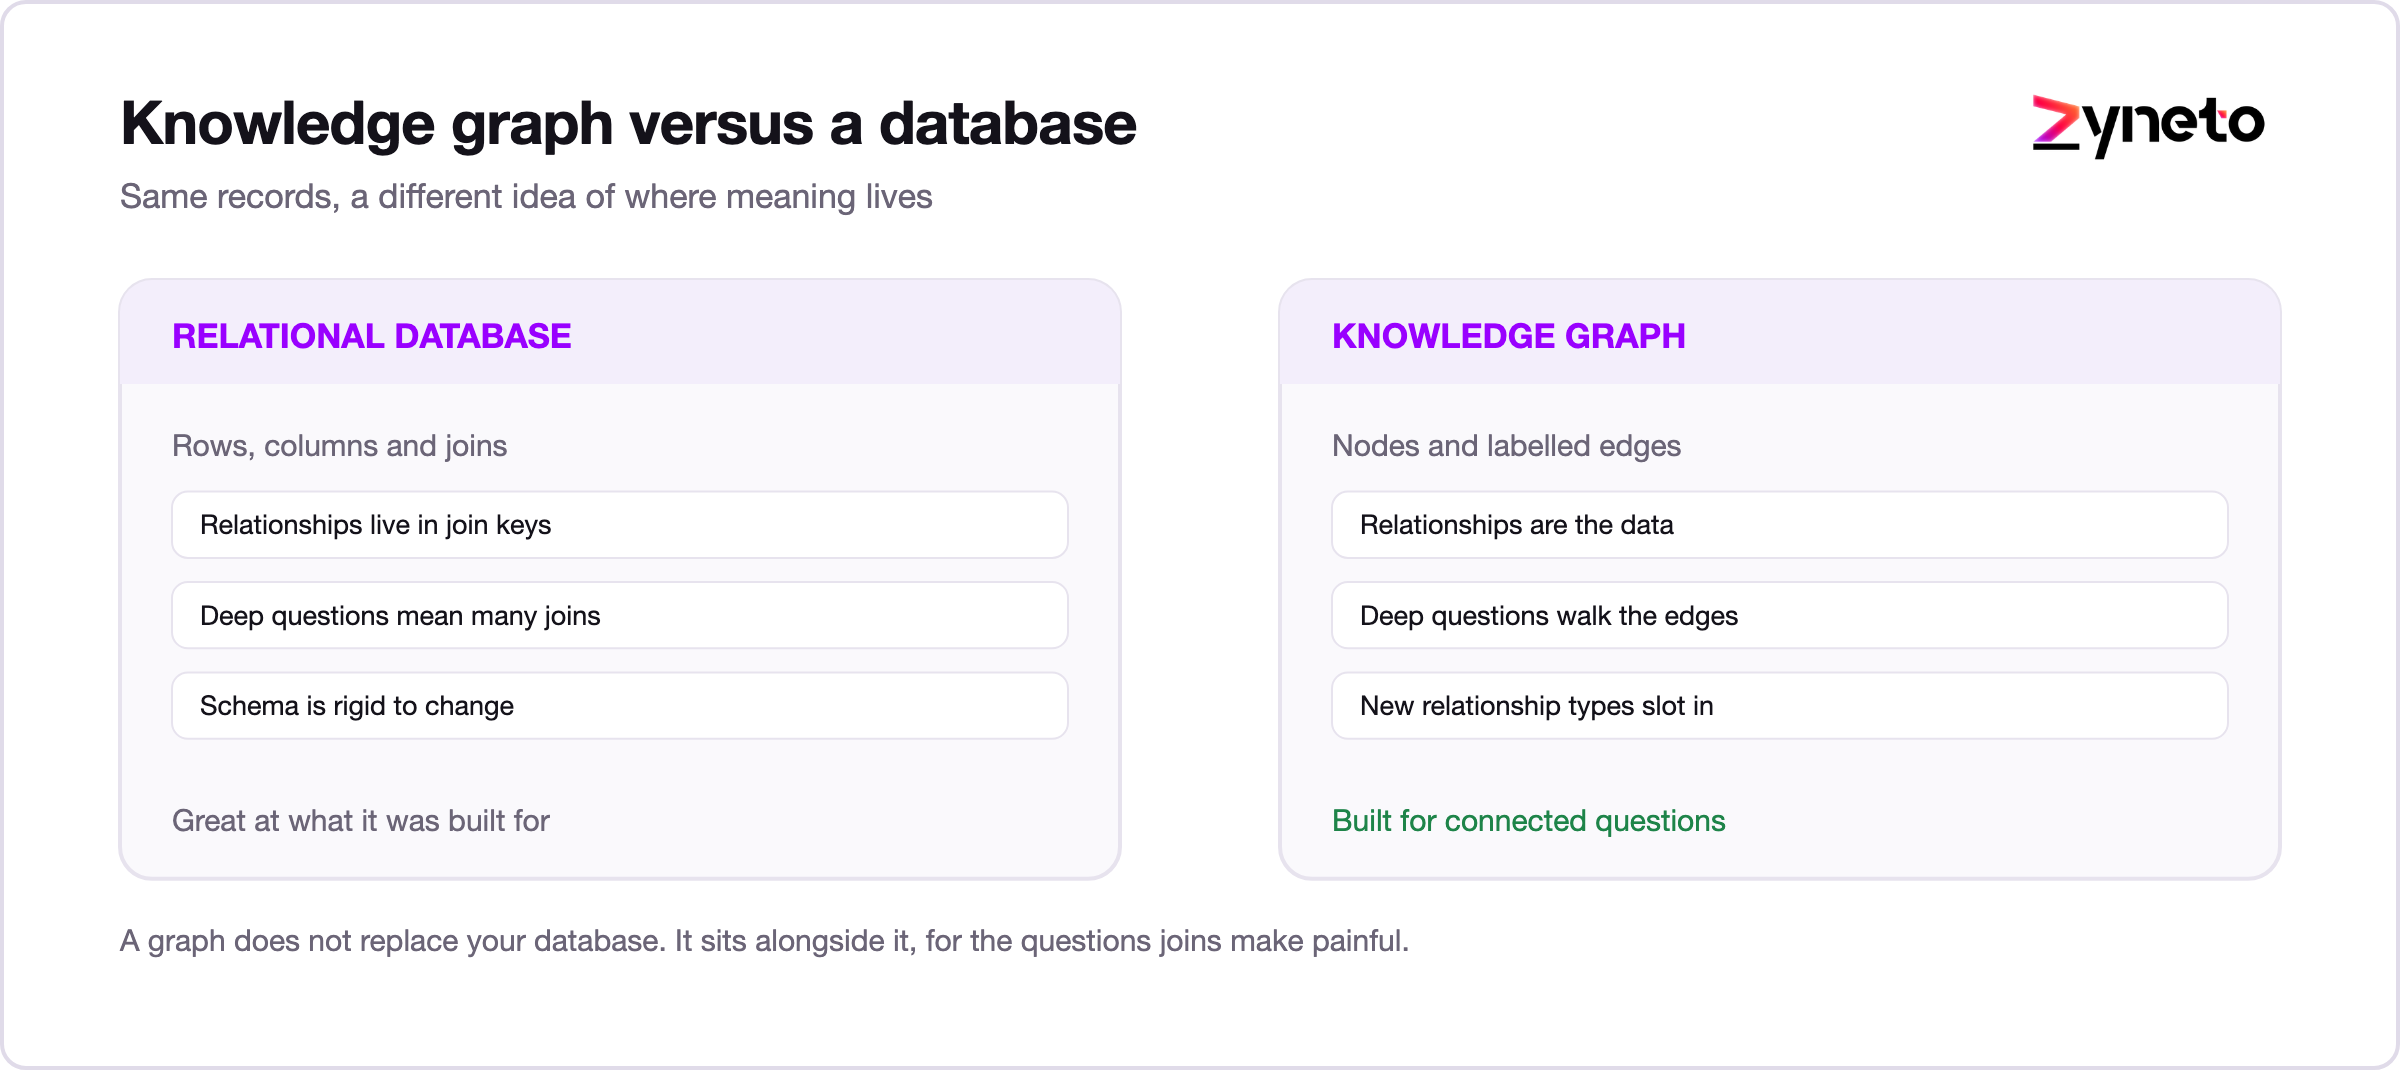
A relational database stores data in tables, and it is excellent at that. Relationships live in the joins between tables, and for simple, fixed relationships that works perfectly well. The trouble starts when the relationships get deep or variable, when you want to ask "find everything connected to this, three or four hops out." Every hop is another join, so a 4-hop question becomes a 4-way join, and the cost climbs with each one instead of staying flat. Real networks are shallower than people expect, which is what makes this bite. When Facebook measured the distance between its own users in 2016, it came out at 3.57 hops. The questions worth asking sit exactly in the range relational joins handle worst. A knowledge graph stores relationships directly, so following them is fast and natural, even many hops away. Tables are great for "what are the facts." Graphs are great for "how do these facts connect."
If you have read about AI that answers from your own data, you have met retrieval and vector search. A knowledge graph is a different, complementary tool.
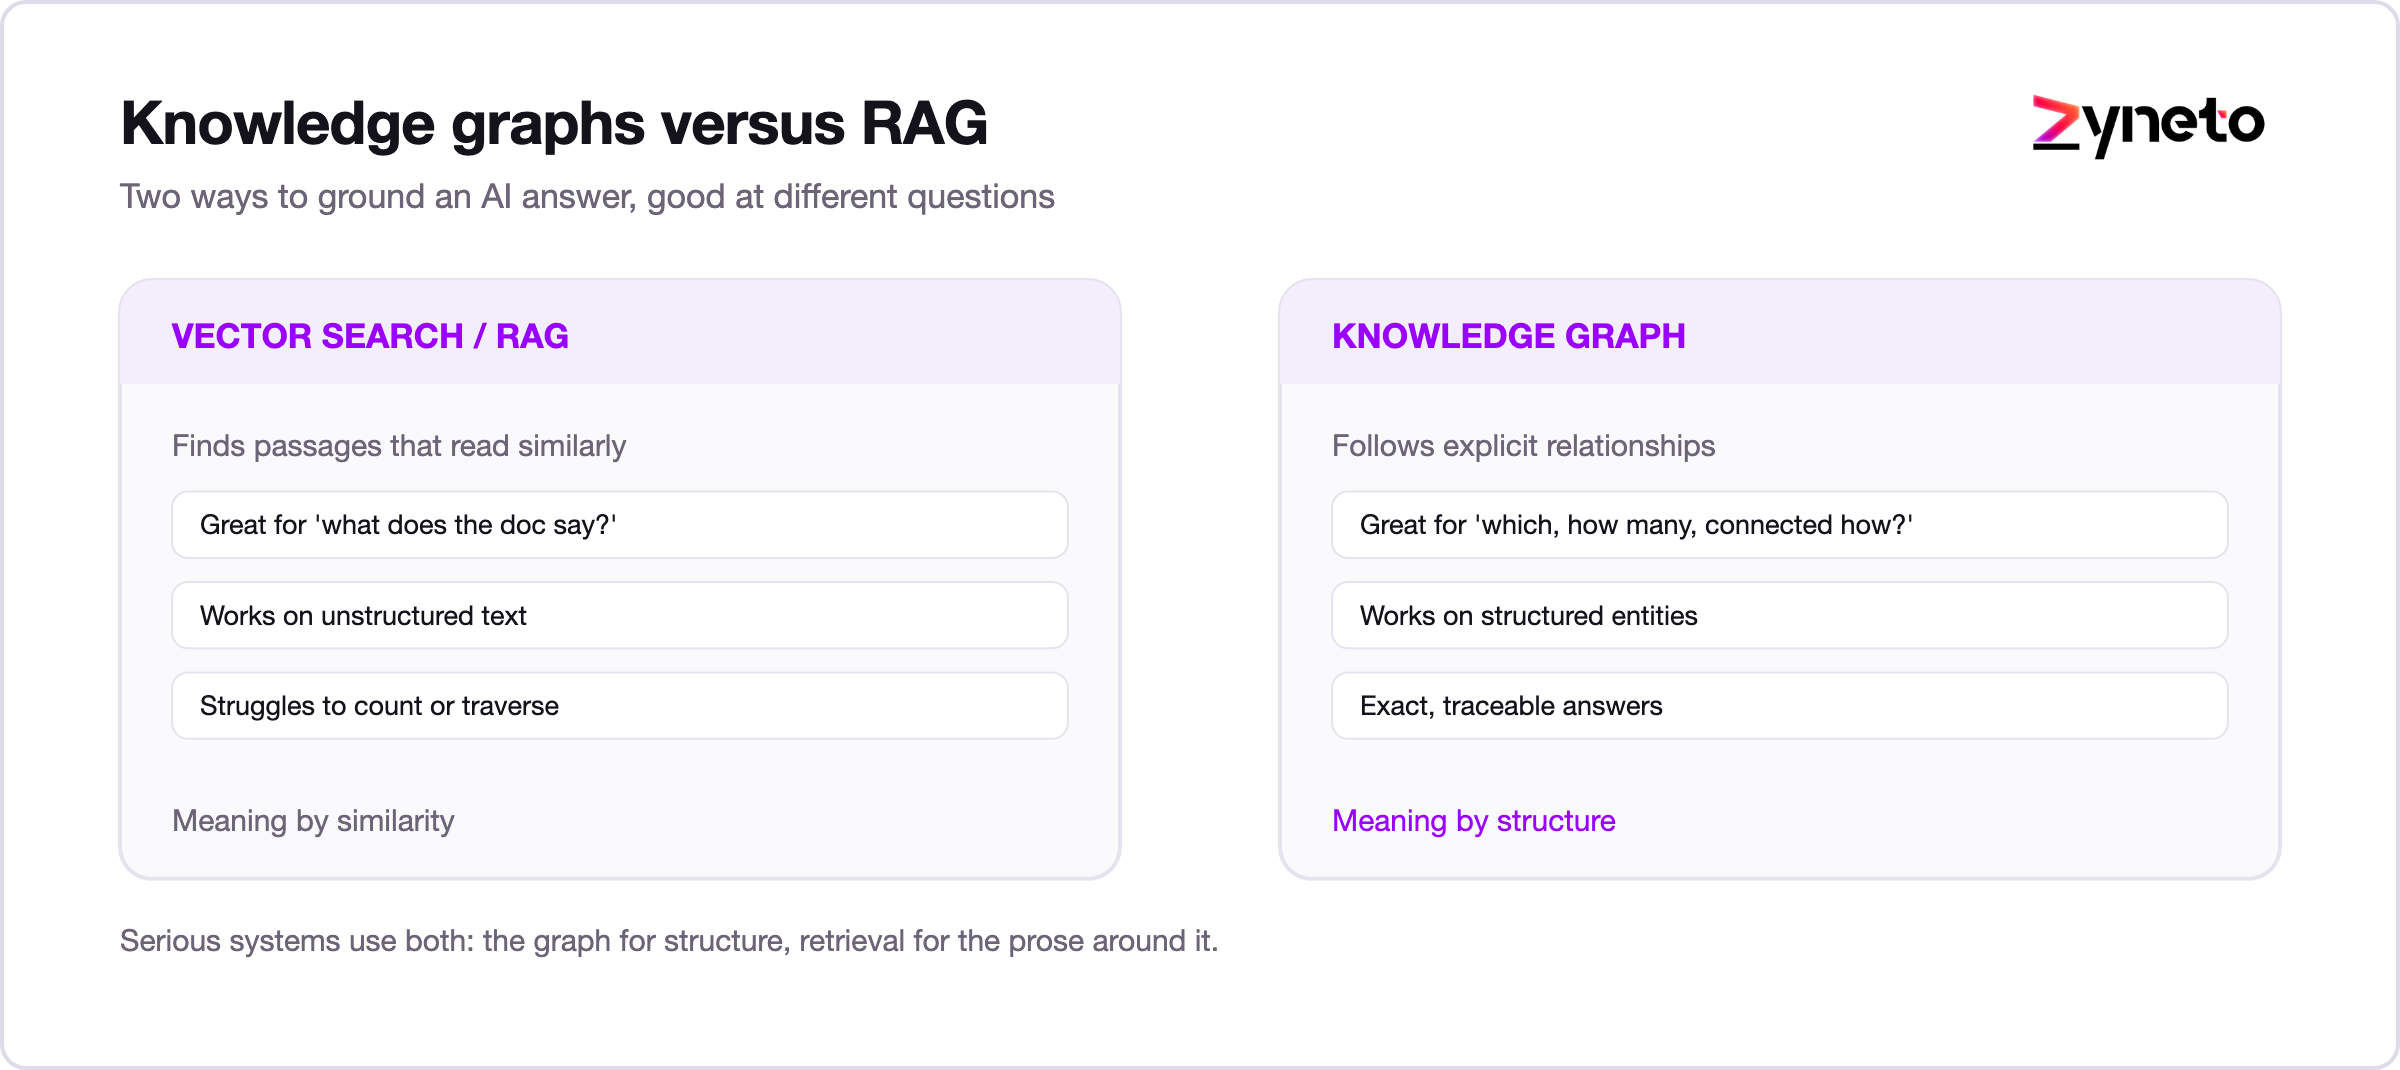
Vector search, the engine behind most retrieval, finds text that is semantically similar to a question. Ask about time off and it surfaces the passage that only ever says annual leave. That is powerful for unstructured content, but it is fuzzy by design, and it struggles with precise, relational questions. A knowledge graph is exact and structured. It does not guess what is similar; it knows what is connected. The two pair beautifully, and modern systems increasingly run them together, using retrieval to find relevant text and a graph to supply the precise relationships, an approach often called GraphRAG, which Microsoft Research published and open-sourced in July 2024. We cover the retrieval half in the guide to chatting with your documents; this is the structured half of that same story.
Large language models are fluent but forgetful, and they will happily invent a connection that sounds right. A knowledge graph gives them a backbone of verified facts and relationships to reason over, which does three useful things.
It grounds answers in real, structured relationships, so the model is not guessing how things connect. It cuts down hallucination on relational questions, because the connections come from your data rather than the model's imagination. And it makes answers explainable, because you can trace the exact path an answer came from, node by node, which matters enormously in regulated industries where "the AI said so" is not an acceptable audit trail. As AI moves into serious enterprise use, this structured, traceable grounding is a big part of why knowledge graphs are having a moment.
The wins show up wherever the relationships carry the value.
Fraud hides in connections: shared addresses, linked accounts, circular transactions between parties that look unrelated one record at a time. A knowledge graph makes those rings visible, so a pattern no single row reveals becomes obvious across the web of them. Banks and insurers lean on this heavily.
Pull a customer's every interaction, purchase, ticket, and account into one connected view, and you finally see the whole relationship instead of fragments scattered across a dozen systems that never talk to each other.
People connected to this are also connected to that. Recommendation engines built on graphs capture the relationships between users, products, and behavior that flat, tabular data quietly misses.
Answer relational questions across contracts and regulations, which vendors are affected by a rule change, which agreements reference a particular entity, that keyword search and tables both handle badly.
Turn a company's scattered knowledge into a connected map, so search understands that two things are related even when they never once share the same words.
Model suppliers, parts, and dependencies as a graph, and you can trace how a disruption at one distant supplier ripples all the way through to the products now at risk.
Diseases, genes, drugs, and trials connect in tangled ways, and graphs are how researchers trace those links, to find, for instance, an existing drug that might treat a new condition. It is one of the oldest and most valuable uses of the whole idea.
The thread through all of it: when the answer depends on how things connect, not just on what a record says, a knowledge graph is the right tool for the job.
A quick, illustrative picture, because "relationships" stays abstract until you watch one pay off.
A bank is chasing a fraud ring. In their tables, each account looks ordinary: a name, an address, a handful of transactions, nothing that jumps out. Loaded into a knowledge graph, the picture changes. Three accounts share a phone number. Two share an address with a fourth that was flagged last year. Money moves in a small circle between them and back out through a fifth. No single row showed any of that. The connections did, the moment they sat next to each other. The investigator sees the ring on a screen in seconds instead of stitching it together across systems over days. Same data. The only difference is that the relationships were finally first-class, and the fraud that was always there became impossible to miss.
Building one follows a recognizable path, and knowing the shape helps you scope a project honestly.
It starts with deciding what matters: which entities and relationships your questions actually depend on. Then you design an ontology, a schema that defines the types of entities and the ways they can relate, the vocabulary of your graph. You ingest data from your systems and connect it into that structure. Along the way you do entity resolution, the unglamorous but crucial work of recognizing that IBM, I.B.M., and International Business Machines are the same thing, so the graph does not split one entity into three. It is also where the cost hides. Comparing every record with every other is n-squared work: 1 million records is roughly 500 billion pairs before any blocking strategy cuts that down. You store it all in a graph database built for traversal, and you query it with a graph query language. And then, like everything else, you maintain it, because your business and its relationships never stop changing.
The hard part is rarely the graph database itself. It is the ontology and the entity resolution, the human work of deciding what your world looks like and making messy data agree on it.
A word on the machinery, kept practical. Most knowledge graphs come in one of two flavors. Property graphs store nodes and edges with properties directly and are queried with languages like Cypher, which Neo4j opened up as openCypher in 2015, and they suit most business use cases. RDF graphs store every fact as a triple of exactly 3 parts: subject, predicate, object. They are queried with SPARQL, a W3C recommendation since 2008 and at version 1.1 since 2013. They shine where standards and interoperability matter, like life sciences and open data. The gap is closing at the standards level. ISO published GQL as ISO/IEC 39075:2024 in April 2024, the first new ISO query language since SQL itself in 1987. SQL:2023 then added SQL/PGQ, so property graph queries can run inside a relational engine. Either way, the important thing for a buyer is not the format. It is that a graph is queried by traversing relationships, which is precisely what makes the hard, connected questions fast to answer. Your team or your partner picks the flavor that fits the problem. You mostly need to know the choice exists, and that it should be made on purpose rather than by accident.
Knowledge graphs are powerful, but they are not free, and it is worth knowing the sharp edges before you commit.
Data quality bites hard, because a graph exposes the contradictions in bad data that tables quietly hide. Entity resolution is genuinely difficult at scale, and getting it wrong corrupts the graph without a warning light. Ontology design is a balancing act: too rigid and it cannot capture reality, too loose and it becomes a swamp. Maintenance is ongoing, because relationships shift. And the skills are specialized, so the talent pool is smaller than for a standard database. None of these are reasons to avoid a knowledge graph. They are reasons to scope one carefully and, often, to build it with people who have done it before.
A knowledge graph is not the answer to every data problem, and reaching for one when a table would do is a common and expensive mistake.
You need one when your questions are fundamentally about relationships and connections, when they run several hops deep, when the value lives in the web rather than in the records. You do not need one when your data is simple and your questions are direct, when a relational database, or even a spreadsheet, answers them cleanly. And if all you need is to find similar documents, retrieval and vector search are lighter and entirely enough. Reach for a graph when connections are the point, and not a moment before.
The teams that succeed start narrow, the same as with any data project. Pick one high-value question your current systems answer badly precisely because it is about connections: a fraud ring, a true customer view, a compliance trace. Model just the entities and relationships that one question needs, not the whole business, because a small, sharp graph beats a sprawling, half-finished one every time. Connect the handful of data sources it depends on, do the entity resolution properly on those, and build a first graph that answers the one question well. Show it working, then widen the ontology and the data to the next question. The projects that fail almost always try to model the entire enterprise on day one, which is how a graph becomes a two-year science project instead of a tool that earned its keep in a quarter.
The return on a knowledge graph comes from questions you could not answer before, or could only answer slowly and by hand.
Fraud caught because it hid in the connections. A customer view that was scattered and is now whole. Compliance questions answered in seconds instead of a week of manual tracing. Recommendations that lift revenue because they finally understand relationships. And AI answers you can actually trust and explain, because they stand on structured facts rather than a lucky guess. To build the case, find one high-value question your current systems cannot answer well precisely because it is about connections, and estimate what answering it reliably is worth. That question funds the first graph.
The failures rhyme. Building a graph when a table would have done the job, and paying for complexity nobody needed. Skipping the ontology work and ending up with a tangle instead of a model. Underestimating entity resolution, so the graph is quietly wrong from the start. Treating it as a one-time build rather than a living model that needs tending. And building the graph with no clear question it is meant to answer, which is complexity for its own sake. A knowledge graph earns its cost only when it answers a question that actually matters.
Two currents are pushing knowledge graphs forward at once. The first is AI: as companies build assistants and agents on top of their data, the need for structured, traceable grounding has made graphs newly important, and GraphRAG, pairing graphs with retrieval, is spreading quickly. The second is tooling: building and maintaining graphs is getting easier, and AI itself is now helping pull entities and relationships out of messy text, which was always the bottleneck. The direction is toward graphs that are cheaper to build, easier to keep current, and increasingly the backbone that lets AI reason about a business rather than merely describe it.
A knowledge graph stores your information as entities and the relationships between them, which makes connections as queryable as facts. It shines where relational, multi-hop questions live, in fraud, customer 360, compliance, recommendations, and supply chain, and it is increasingly the structured backbone that grounds and explains enterprise AI. It is not a replacement for your database or for retrieval; it is the right tool for when connections are the point. Build one when your value sits in the web of relationships, invest properly in the ontology and entity resolution, and tie it to a question worth answering. A graph that answers one real question beats one that models the whole company and answers nothing.
If your hardest questions are about how your data connects, Zyneto builds enterprise knowledge and data solutions that turn scattered records into answers you can trust and explain. Book a free consultation and we will map the few entities everything else hangs off.
It is a way of storing information as things and the relationships between them, so the connections are as easy to query as the facts. Entities are the things, relationships are the links, and together they form a network you can explore.
A relational database stores data in tables and handles relationships through joins, which get slow and awkward for deep or variable connections. A knowledge graph stores relationships directly, so following them many hops out is fast and natural. Tables suit facts; graphs suit connections.
RAG uses vector search to find text that is semantically similar to a question, which is fuzzy by design. A knowledge graph gives exact, structured relationships. They complement each other, and combining them is often called GraphRAG.
Fraud and risk detection, customer 360 views, recommendation engines, compliance and contract analysis, enterprise search, and supply-chain mapping. Anywhere the value is in how things connect rather than in single records.
They ground a language model in verified relationships, reduce hallucination on relational questions, and make answers explainable, because you can trace the exact path an answer came from. That traceability matters a great deal in regulated industries.
When your important questions are about relationships and run several hops deep, and when the value lives in the connections rather than the records. If your data is simple or you only need similar documents, a database or vector search is lighter and enough.

Vikas has around fifteen years of experience building software and now builds generative AI systems at Zyneto. His work covers retrieval augmented generation, agentic AI, knowledge graphs, AI memory, and the evaluation and guardrails that decide whether any of it is safe to put in front of customers. He has shipped enterprise copilots, document AI, chatbots and predictive analytics for e-commerce, fintech and marketing teams, and works day to day in Python, JavaScript and SQL. He follows multimodal models, business process automation and enterprise AI security closely, and mentors engineers moving into AI. He writes about architecture, inference cost and the failure modes that only show up at production scale.
Share your details and we will talk soon.
Be the first to access expert strategies, actionable tips, and the trends actually shaping the digital world. No fluff - just practical insights delivered straight to your inbox.
Dive into our blog and stay ahead of the curve with expert perspectives, future-ready trends, and tech tips written for decision-makers and doers alike.