Custom Dashboard Development: Why Most Go Unused, and What to Build Instead


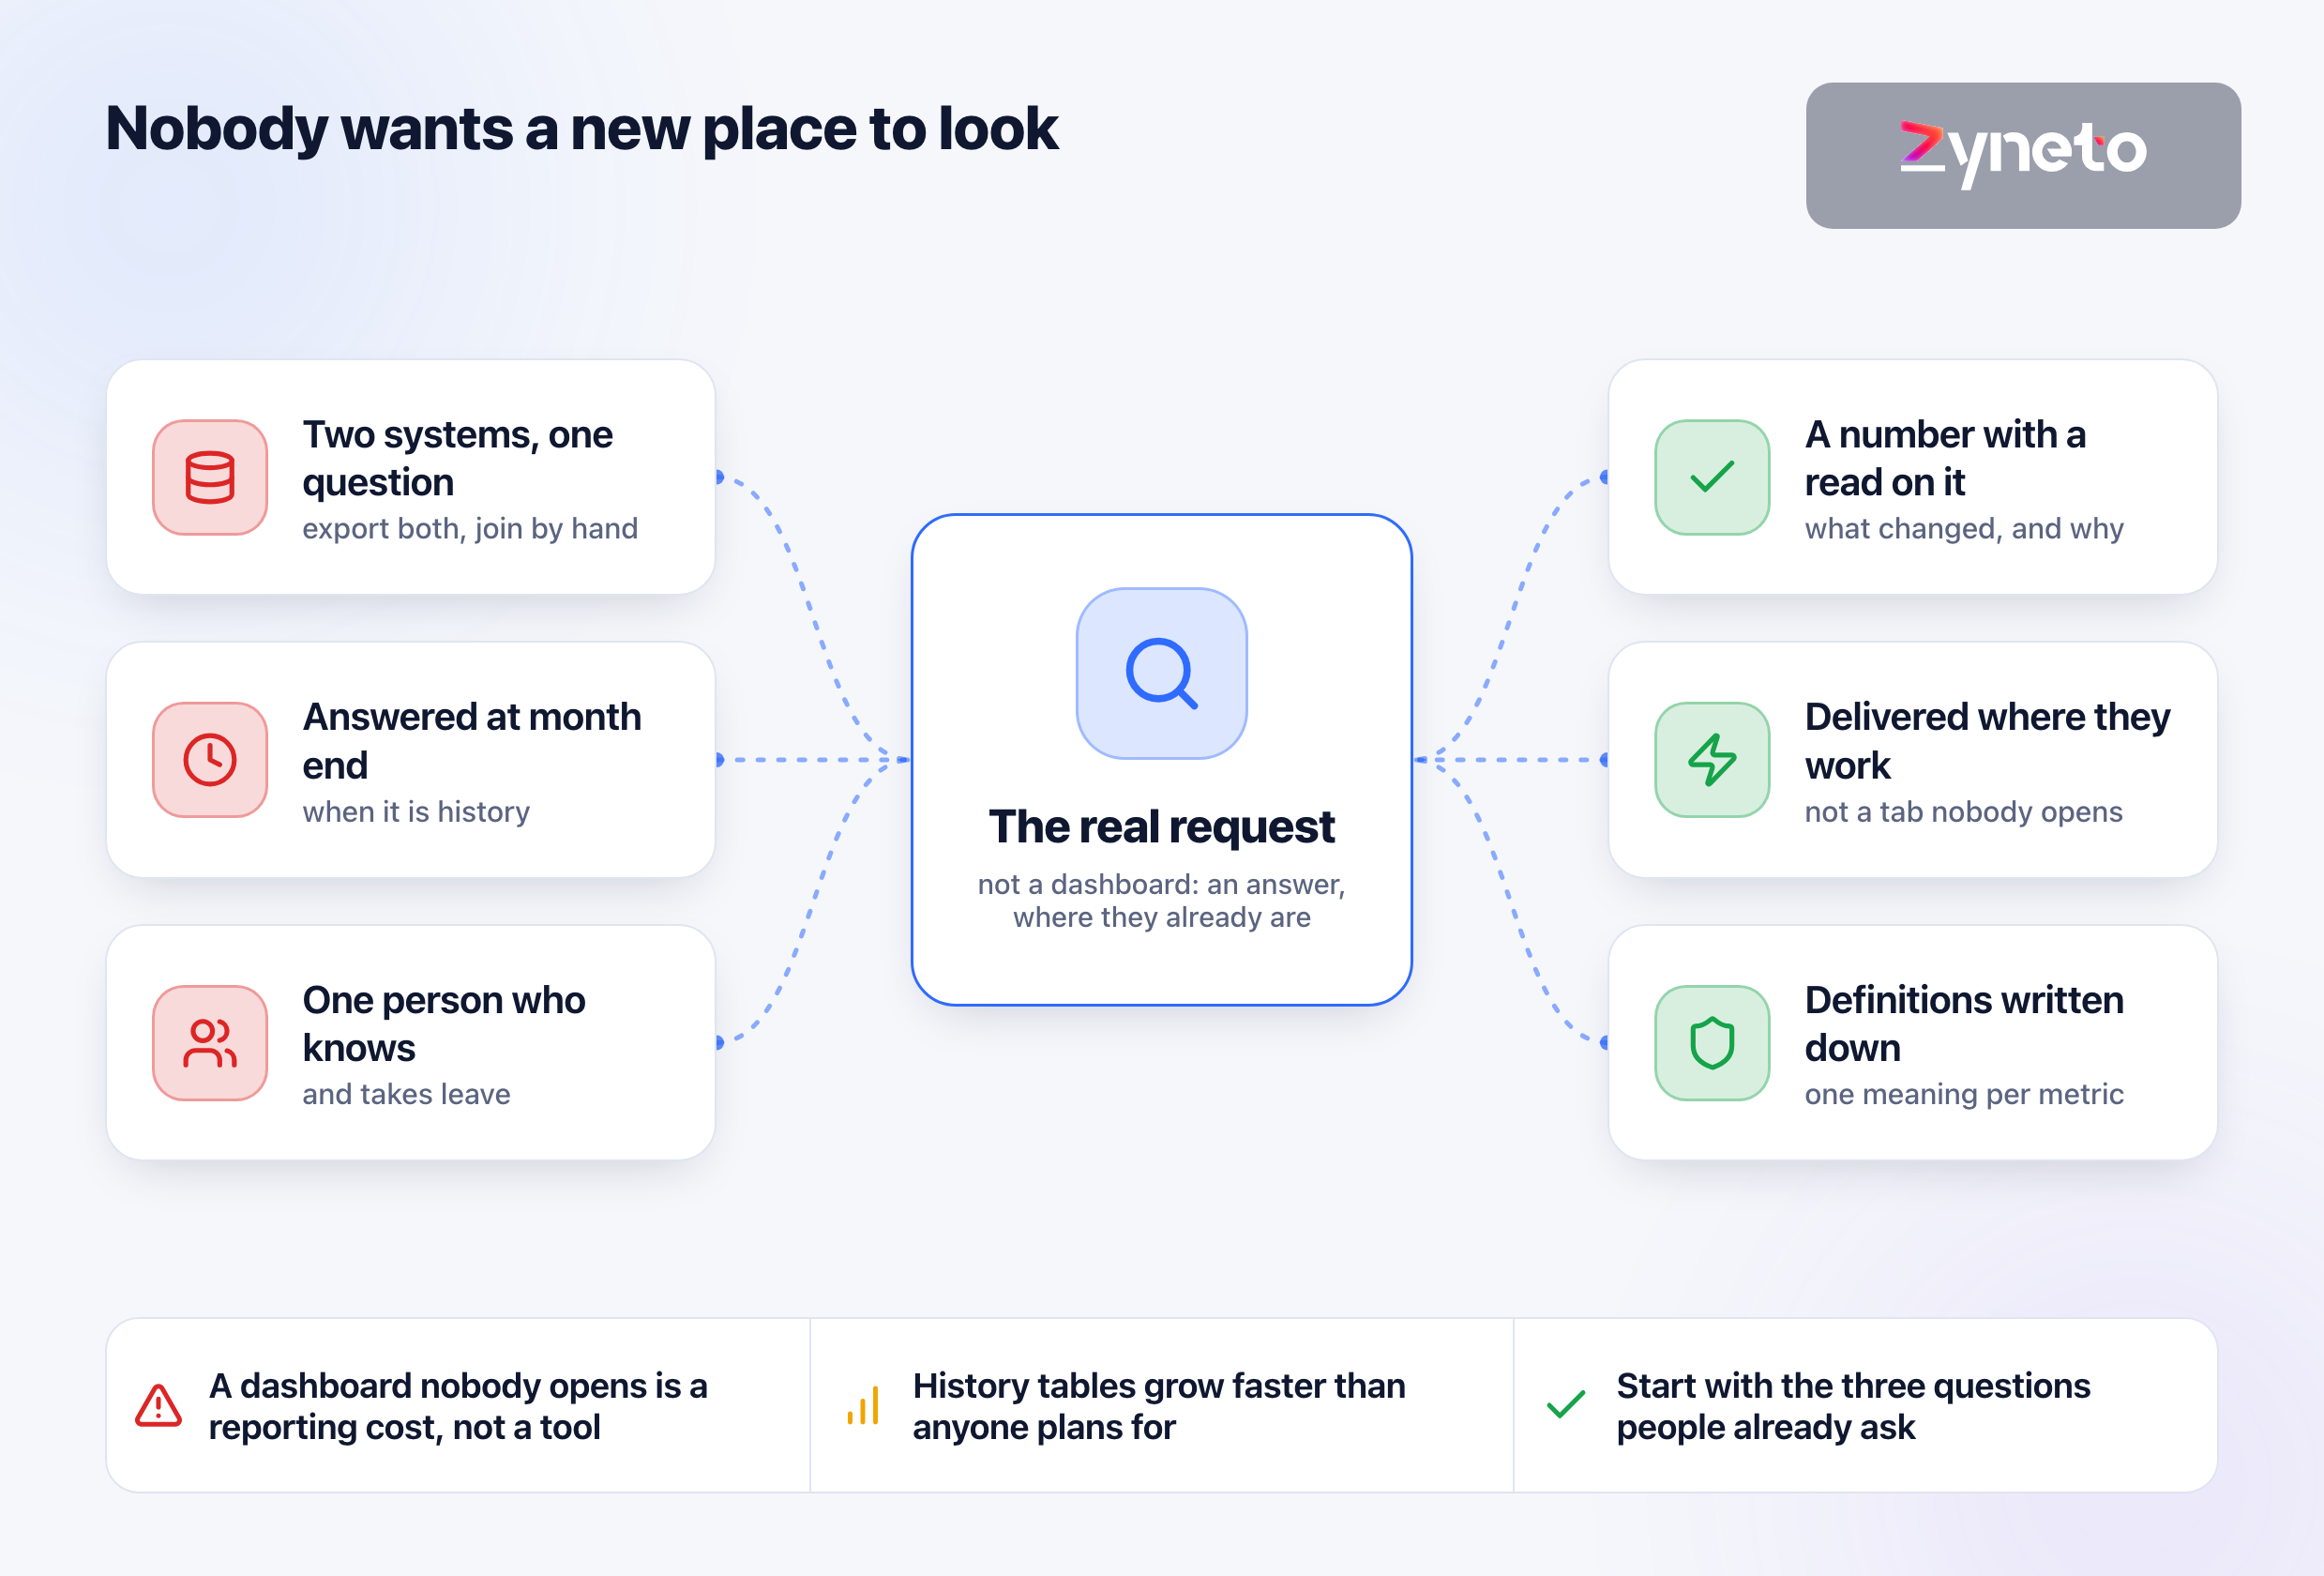
The request is almost never a dashboard. The request is an answer to a question that currently takes two exports and a spreadsheet, delivered somewhere the person asking already looks.
We learned the sharper version of that building reporting for Cheersagar, a garment business whose books sit in Zoho and whose customer records sit in an internal CRM. Answering an ordinary question — which style is earning, which customer is slow, how this month reads against last — meant exporting from both systems and joining them by hand. The second problem was that nobody wanted a new place to look.
That second problem kills more dashboard projects than any technical failure. A dashboard is a new habit, and new habits lose to existing ones unless the new one is faster. So the useful framing is not "what should we show" but "what question is someone currently answering the hard way, and can we answer it where they already are".
The ordinary failure here is not a broken build. It is a dashboard that was delivered, demonstrated, praised, and opened twice in the following quarter — while the spreadsheet it was meant to replace is still being updated every Monday.
What are the three questions? Not twenty. Three. A dashboard that answers three questions well beats one that displays forty metrics, because forty metrics is a search problem and three answers is a glance. The rest can exist as a drill-down for the person who wants it.
Who settles a disputed number? Two systems will disagree, and the moment they do, somebody has to own the definition. If nobody does, the dashboard makes the argument faster rather than ending it, and people go back to the figures they personally trust.
Where will this be looked at, and when? A number checked daily at 8am before a shift has different freshness requirements from one reviewed monthly. The answer also decides the delivery surface — a screen, an email, a message in a channel — and the right answer is frequently not a web page at all.
Settle those three and the build is straightforward. Skip them and the quality of the engineering will not save it.
The hard part of most dashboard work is not the pipeline or the charts. It is that "revenue" means three things in one company and nobody has written down which one the dashboard shows.
Booked or invoiced or collected. Gross or net of returns. Including or excluding intercompany. Recognised when shipped or when delivered. Each is defensible, each is used by someone, and a single unlabelled number on a screen will be read as whichever one the reader has in mind — which means it will be wrong for most of its audience while appearing authoritative to all of them.
Write the definition next to the number. Not in documentation nobody opens: on the page, in small text, stating the basis and the source system. It costs nothing, it ends most disputes before they start, and it is the single highest-return habit in this entire category.
Then give each metric an owner. Not a technical owner — a business owner who can decide, when two systems disagree, which one is right. A metric without that person is a metric that will eventually be quietly distrusted.
The ownership question has a second half people skip: what happens when the definition changes. A business redefines revenue, or starts excluding a category, or moves recognition from shipment to delivery — and every historical number on the dashboard now means something slightly different from the ones beside it. Deciding in advance whether history is restated or left on the old basis, and labelling which, is the difference between a chart that can be trusted across a year and one that quietly lies about its own past.
This is the part that separates a report from something people act on.
On the Cheersagar build we added an AI layer with a deliberately narrow brief: it writes the read on a number without ever producing the number itself. The figure comes from the data, deterministically, the same way it always did. What the model adds is the sentence a competent analyst would write underneath it — what changed, against what, and what is unusual about it.
That separation is the whole design. A model that calculates can be wrong in ways nobody notices. A model that only comments can be wrong in ways anyone reading can immediately see, and the number underneath it is still correct. Generation sits on top of the arithmetic, never inside it.
It also solves the adoption problem more effectively than any visualisation choice. A person who opens a screen and sees a chart has work to do. A person who sees "margin is down 3 points on last month, almost entirely on one customer" has already been given the answer, and will come back.
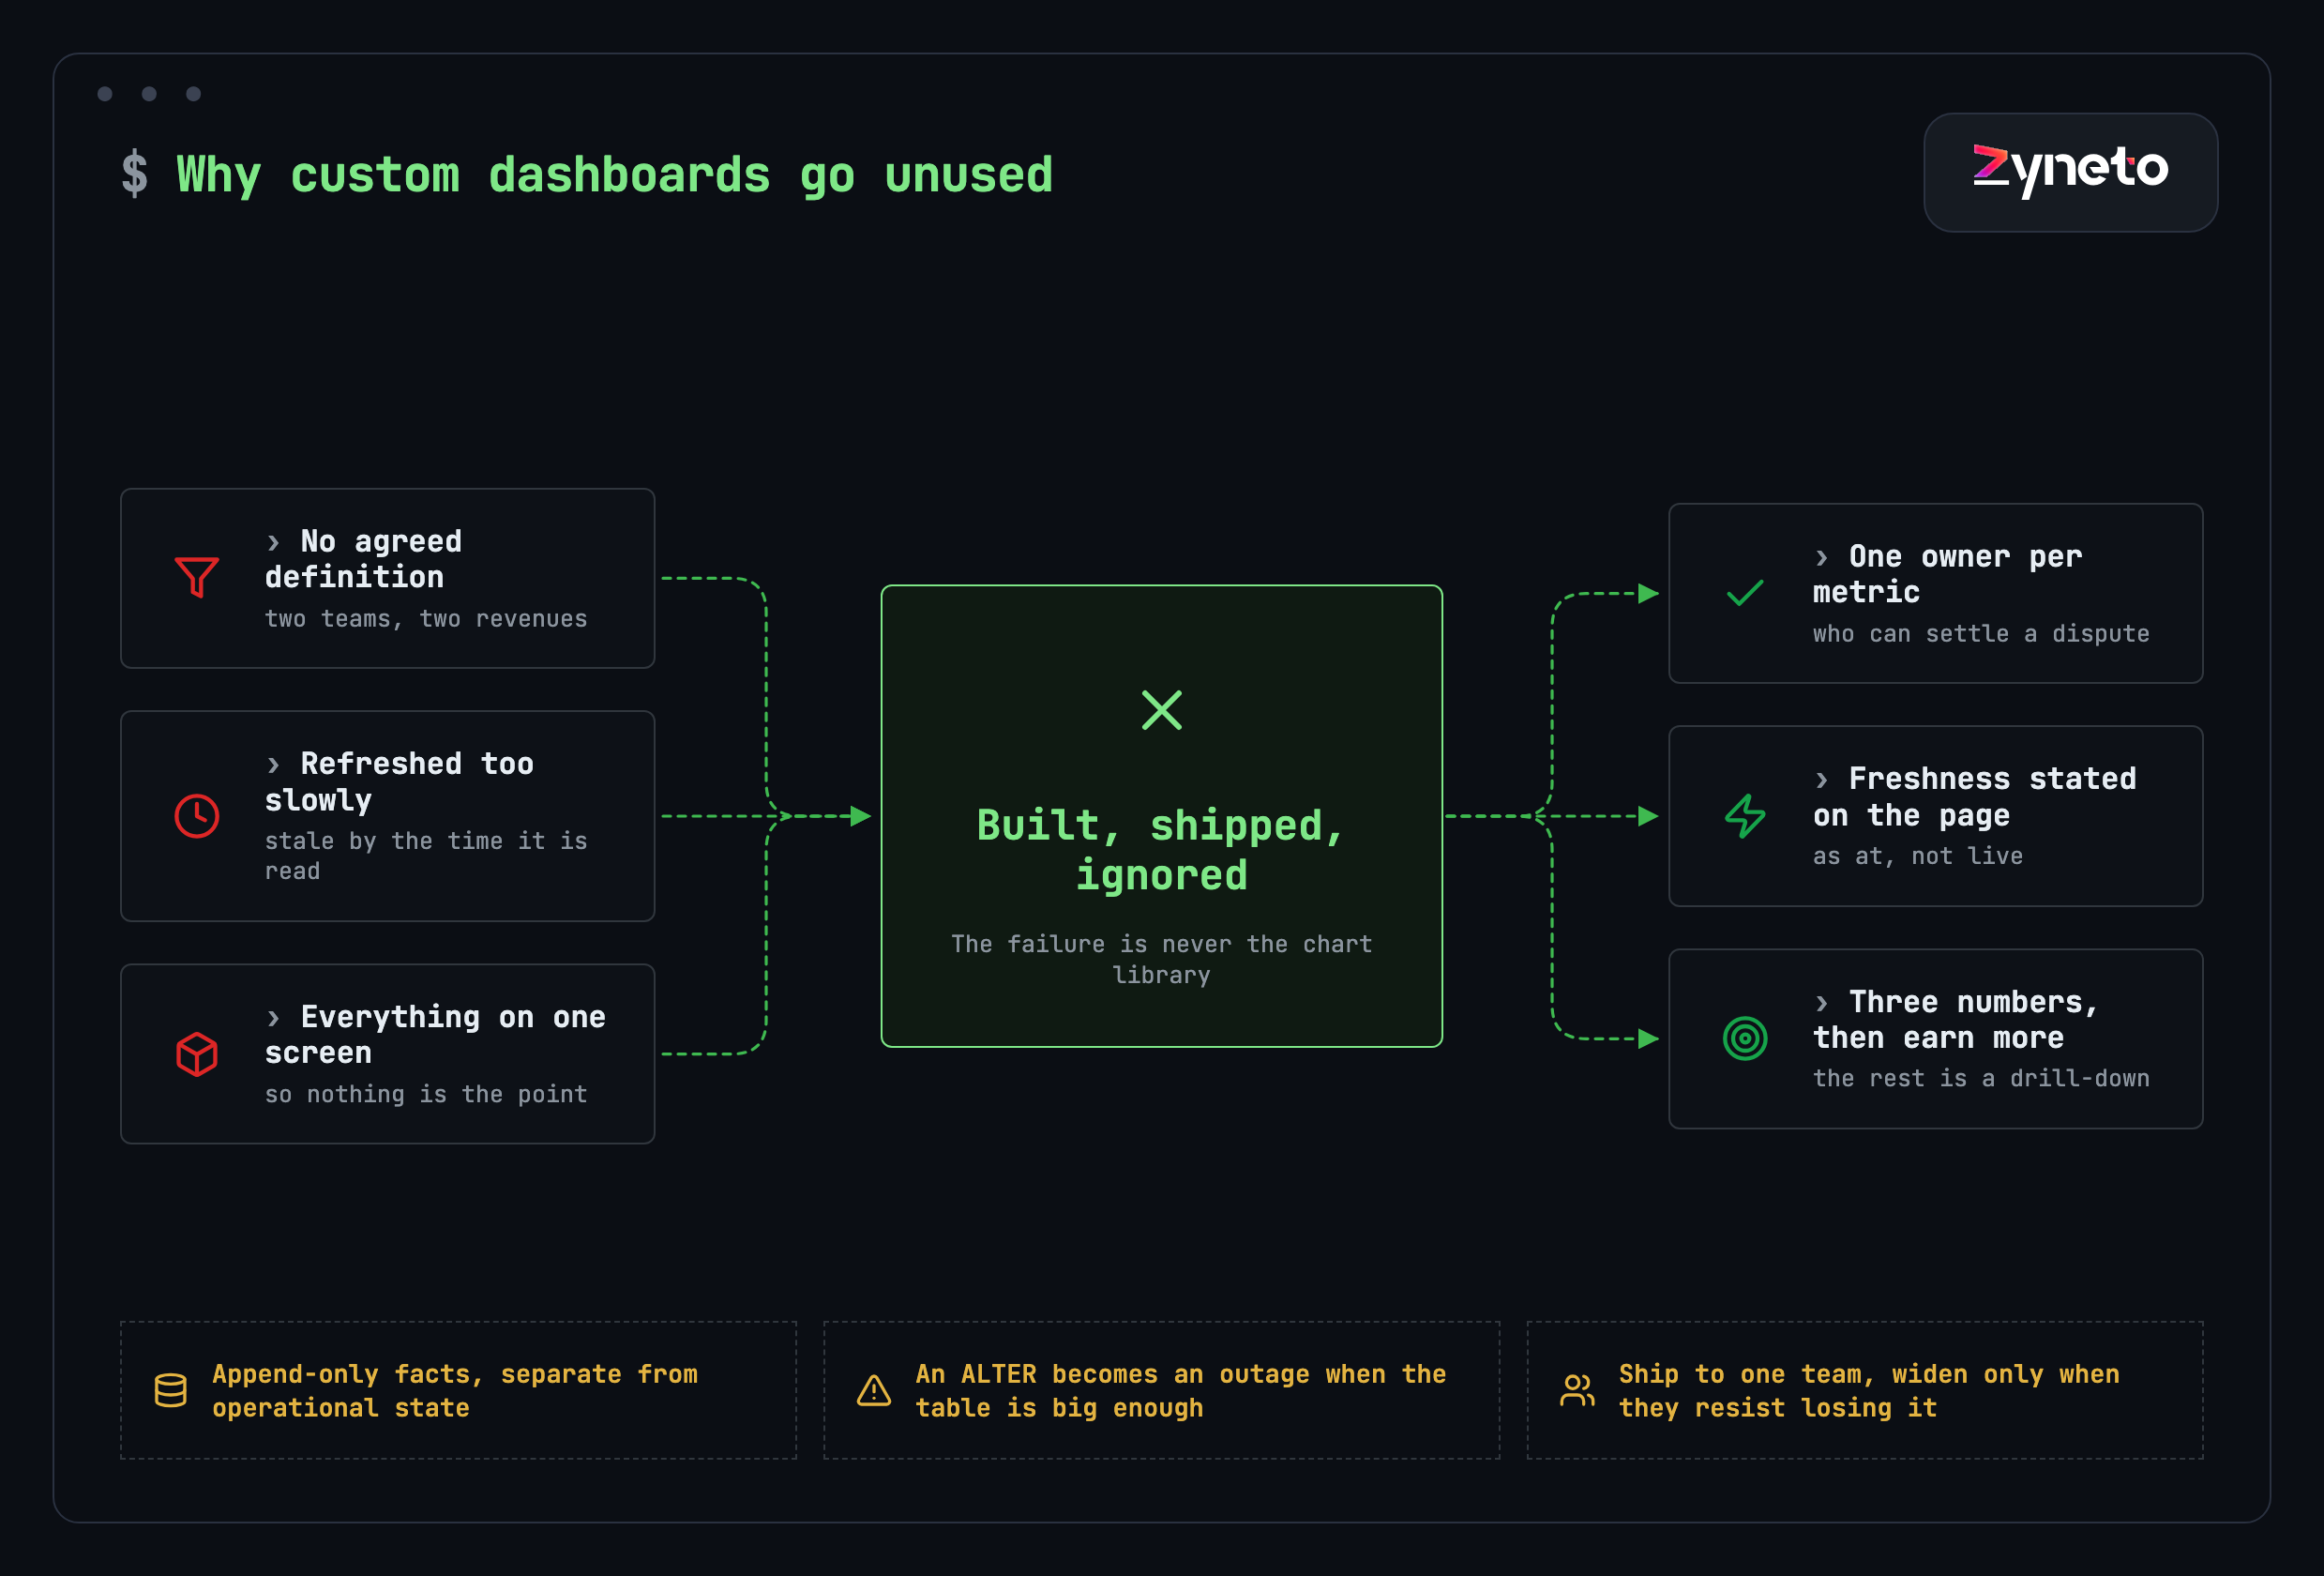
Three failure modes, and the chart library is not among them.
No agreed definition, as above. Two teams hold two revenues and the dashboard picks one without saying so.
Refreshed too slowly for the decision it serves. A number that updates nightly cannot support a decision made at 11am, and users learn that quickly and stop trusting the whole surface rather than that one tile. The fix is often to state freshness on the page — "as at 06:00" — rather than to make everything real-time, which is expensive and usually unnecessary.
Everything on one screen, so nothing is the point. This happens when a dashboard is specified by collecting requests from everyone rather than by choosing. The result satisfies the specification and serves nobody, because the person with three questions cannot find them among forty tiles.
Having decided where people will look, the honest answer is frequently that they will not look anywhere. They will read what arrives.
A daily figure that matters belongs in a message, not behind a login. Operations leads check a channel far more reliably than they open a reporting tool, and a number delivered into the place they already are converts to action at a rate a web page does not approach.
A weekly comparison belongs in an email, with the read written underneath it, because that is a format people forward to someone else — which is how a number becomes a decision involving more than one person.
A number used inside a workflow belongs inside that workflow. A credit position should appear on the order screen, not on a finance dashboard the salesperson will never open. The same figure in two places serves two audiences, and only one of them needs a chart.
The screen still earns its place for exploration: the drill-down when the pushed number raises a question. But treating the screen as the product rather than as the destination is the most common design error in this category, and it is upstream of most adoption failure.
Concretely, because "start small" is advice nobody can act on.
One screen or message with three numbers. Each carrying its definition in small text beside it, and each with a stated freshness — "as at 06:00" rather than an implication of being live.
One comparison per number, because a figure with nothing to compare against is not information. Against last period, against plan, or against the same period last year: pick one and keep it consistent rather than varying it per tile.
One level of drill-down, so a number that looks wrong can be interrogated without a request to the data team. That single level prevents most of the ad-hoc queries a reporting backlog is made of.
Nothing else. No filters nobody asked for, no date-range picker before anyone has asked for a different range, no secondary tab. Every one of those is a decision deferred onto the user, and each costs a little adoption at the moment when adoption is most fragile.
If that sounds thin, it is meant to. The version that succeeds is the one somebody missed when it was briefly unavailable, and nothing on the list above is there because it would be nice to have.
The sequencing that works, and it is the opposite of how these projects are usually scoped.
Pick one team with a real, repeated question. Build the smallest thing that answers it, in the place they already work. Widen only when another team asks to be included — which is the only reliable signal that the first one is genuinely used.
The alternative, building for the whole organisation at once, produces a system designed by committee where every team's requirement is present and no team's workflow is served. It also makes adoption unmeasurable: when nobody uses it, there is no way to tell whether the problem was the metrics, the delivery or the definitions.
A small, used dashboard is also the cheapest possible way to discover what the organisation actually needs, because the second and third requests arrive from people who have seen the first one work.
Pick the team deliberately, too. The best first candidate is one with a question they ask often, a clear owner who can make decisions without convening anybody, and enough pain that they are already doing the work manually. That last condition matters most: a team already maintaining a spreadsheet has proven the question is worth answering, and replacing a thing that exists is far easier than introducing a habit that does not.
Avoid starting with the executive view, however tempting it is politically. Executive dashboards aggregate numbers that have to be right everywhere else first, they are consulted infrequently enough that errors survive for weeks, and the people who use them are the least able to say what is wrong with them. Build upward from an operational team that will notice a bad number the same morning, and the executive view becomes a straightforward summary of something already trusted.

Dashboards are read-heavy systems built on top of write-heavy ones, and that tension produces the engineering work that estimates miss.
Building Stylebank, which pulls marketplace orders, factory production and accounting into one place for four apparel businesses, the recurring problem was growth in the reporting tables. A row per style per day per channel per metric compounds quietly, and nothing in the application tells you. You find out when a backup stops fitting its window, or when an ALTER becomes an outage rather than a migration.
Archiving buys time. The structural fix is to stop mixing an append-only fact stream with operational state — facts accumulate and are never updated, operational records change constantly, and the two want different storage, different indexes and different retention.
The practical signal to watch for is a reporting query that has started to need its own index. Once the operational database carries indexes that exist only to serve a chart, the two workloads are already in conflict, and every write is paying a small tax to make a read faster. That is the moment to separate them, and it arrives earlier than most teams expect.
There is a second, subtler problem in the same build: channel data restates itself. An order cancels after picking, a return lands weeks after the sale, settlement follows on its own cycle. Ingest that as an append and you double count. The pattern that works is to upsert on the source's own identifier and carry a snapshot date, so the record is the latest known state with its history intact.
Both are cheap to design in and expensive to retrofit, which is the recurring theme of every system where numbers have to be trusted.
A fair question, since several products will give you dashboards without a build.
Buy a BI tool when your data already lives in one warehouse, your questions are exploratory, and the people asking them are comfortable building their own views. That is a large and well-served category and a custom build competes badly with it.
Build custom when the answer has to reach people who will never open a BI tool, when it has to live inside an existing application rather than beside it, or when the hard part is consolidation rather than visualisation — several systems, none of them authoritative, needing reconciliation before any chart is meaningful.
Famepilot is an example of the third case: reviews and feedback from more than 25 platforms consolidated into one view, classified by sentiment, with a drafted reply attached. The value there is not the chart. It is that 25 sources became one workflow, and no off-the-shelf dashboard does the consolidation.
Short section, routinely skipped, and it tells you whether any of this worked.
Who opened it, how often, and did that rate hold after the first fortnight. Which tiles were looked at and which were never clicked. Whether the spreadsheet it was meant to replace is still being updated — the single most honest adoption metric available, and the easiest to check by simply asking.
If usage drops after two weeks, the problem is almost always one of the three failures above rather than anything about the interface. Fix the definition, the freshness or the focus, in that order, and resist the instinct to add features to a thing nobody is using.
Set a review date at the start, four to six weeks out, and treat it as part of the delivery rather than as a favour. By then the honeymoon is over and the usage figure means something. A short conversation at that point — what did you stop using, what did you start exporting again, what question came up that this does not answer — produces better direction than any amount of upfront requirements gathering, because the people answering have now seen a working thing.
Three reasons, none of them technical. There is no agreed definition behind the numbers, so two teams read the same tile differently and both eventually distrust it. The refresh rate does not match the decision it supports — a nightly number cannot serve an 11am decision, and users learn to distrust the whole surface. And everything ends up on one screen because the specification was assembled by collecting requests rather than by choosing, so the person with three questions cannot find them among forty tiles.
Three things. What are the three questions it must answer, not twenty. Who settles a disputed number, because two systems will disagree and someone has to own each definition. And where and when it will be looked at, which decides both the freshness requirement and the delivery surface — frequently not a web page at all, but an email or a message where the person already works.
Often, yes. Buy when your data already sits in one warehouse, the questions are exploratory, and the people asking them will build their own views. Build custom when the answer has to reach people who will never open a BI tool, when it must live inside an existing application rather than beside it, or when the hard part is consolidation rather than visualisation — several systems, none authoritative, needing reconciliation before any chart means anything.
To write the read, never to produce the number. On one build we added a layer that comments on a figure without calculating it: the number comes from the data deterministically, and the model supplies the sentence an analyst would write underneath — what changed, against what, and what is unusual. A model that calculates can be wrong invisibly. A model that only comments can be wrong in ways any reader catches, with the number underneath still correct.
Growth and restatement. Reporting tables compound quietly — a row per entity per day per channel per metric — and nothing in the application warns you until a backup stops fitting its window or a schema change becomes an outage. Separately, source data restates itself: an order cancels after picking, a return lands weeks later, settlement arrives on its own cycle. Ingesting that as an append double counts; upserting on the source's identifier with a snapshot date keeps the latest state and its history.
Measure the dashboard, not just with it. Who opened it, how often, and whether that held after the first fortnight. Which tiles were never clicked. And most honestly, whether the spreadsheet it was meant to replace is still being updated every week — which you can establish by asking rather than by instrumenting. If usage drops after two weeks, fix the definition, the freshness or the focus in that order before adding anything.
It depends almost entirely on the consolidation work rather than the interface. A dashboard over one clean data source is a small piece of work. One that reconciles several systems where none is authoritative is a data project with a dashboard at the end, and the reconciliation is where the hours go. We do not publish a figure for this category because the range is genuinely too wide to be useful — discovery establishes how many sources, how dirty, and how much they disagree.

Vikas has around fifteen years of experience building software and now builds generative AI systems at Zyneto. His work covers retrieval augmented generation, agentic AI, knowledge graphs, AI memory, and the evaluation and guardrails that decide whether any of it is safe to put in front of customers. He has shipped enterprise copilots, document AI, chatbots and predictive analytics for e-commerce, fintech and marketing teams, and works day to day in Python, JavaScript and SQL. He follows multimodal models, business process automation and enterprise AI security closely, and mentors engineers moving into AI. He writes about architecture, inference cost and the failure modes that only show up at production scale.
Share your details and we will talk soon.
Be the first to access expert strategies, actionable tips, and the trends actually shaping the digital world. No fluff - just practical insights delivered straight to your inbox.
Dive into our blog and stay ahead of the curve with expert perspectives, future-ready trends, and tech tips written for decision-makers and doers alike.