CI/CD Pipeline Optimization: What A Slow Build Actually Costs


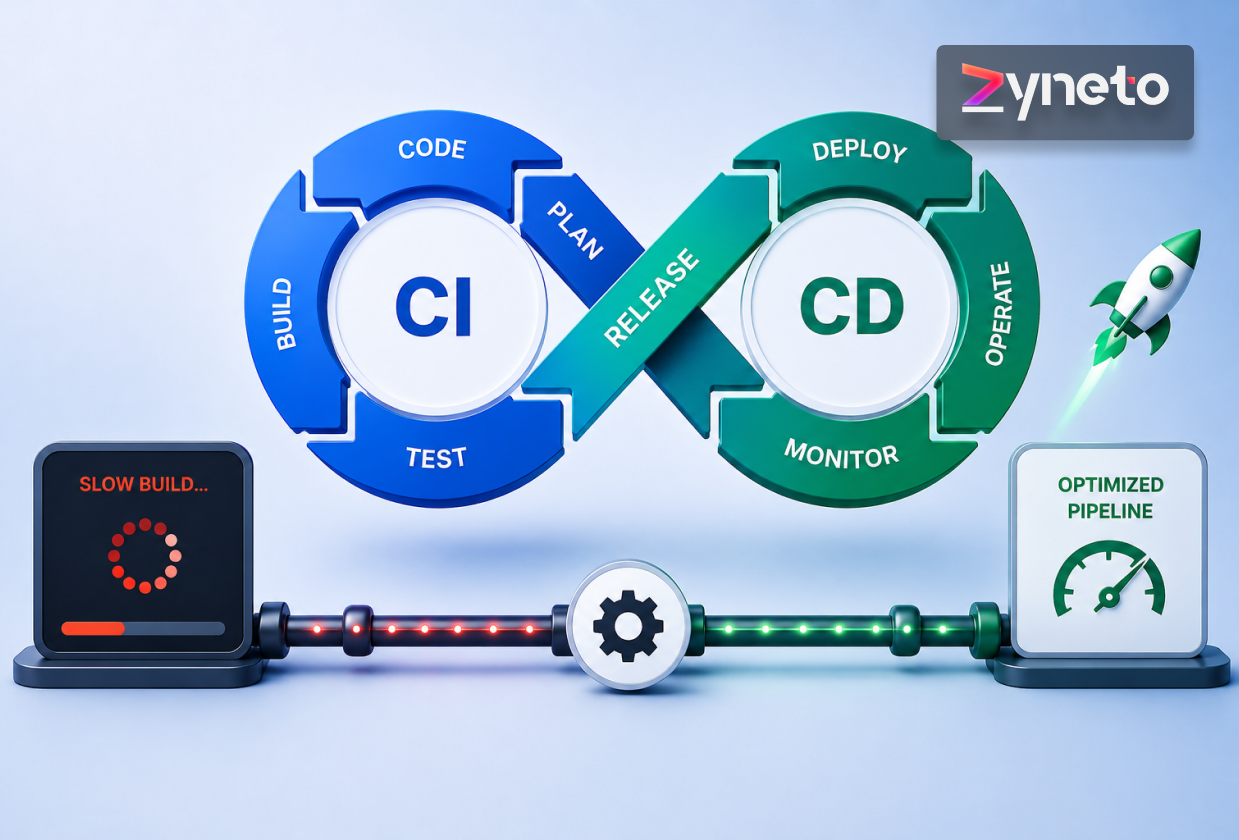
A build takes 38 minutes. Six engineers open a pull request each on a normal day, and most of them get 2 pushes before it is green. Nobody waits and watches, so each cycle costs perhaps 12 minutes of real attention rather than 38, but the context switch is the expensive part and it happens 3 times per person per day.
Call that 36 minutes of lost focus per engineer per day. Across 6 people over 220 working days, that is roughly 790 hours a year, which at a $65 blended rate is about $51,000 of engineering time spent waiting. CI/CD pipeline optimization is usually pitched as an engineering nicety. It is a line item.
Do this arithmetic before touching a configuration file, because it decides how much effort is justified and it is the only version of this conversation a finance director will engage with.
Three inputs. How many pipeline runs per engineer per day. How much attention each run costs, which is not the wall clock time and is usually a third to a half of it. And how many engineers are affected. Multiply, annualise, and put the number on a slide.
Then add the second cost, which is larger and harder to see. A slow pipeline changes behaviour. Engineers batch changes to avoid paying the wait, and batched changes are riskier, harder to review and slower to debug when they break. The pipeline stops being a safety net and becomes a toll booth, and people route around toll booths.
There is a third cost that only appears at the worst moment. When production is broken and the fix is a 2 line change, the pipeline is the distance between knowing the answer and shipping it. A 38 minute build turns a 5 minute fix into a 45 minute outage, and the incident review will blame the bug rather than the delivery path that made it long. Put pipeline duration on your incident timelines and it stops being invisible.
A worked second example, because the first one understates it for larger teams. Twenty engineers, 4 runs each per day, 10 minutes of real attention per run: 800 minutes a day, about 2,900 hours a year, roughly $190,000 at a $65 blend. Teams reliably reach for a bigger runner at this scale and reliably find it buys 3 minutes.
The DORA research programme settled on 4 measures, and they have held up because they resist gaming as a set. Optimise one alone and the others visibly degrade.
1. Deployment frequency. How often you ship to production. Weekly is common. Daily is good. Multiple times a day is achievable for most web systems and is not the goal for everyone.
2. Lead time for changes. Commit to running in production. Under 1 day is strong. Anything over a week usually means the pipeline is not the bottleneck, the approval process is.
3. Change failure rate. The share of deployments causing degradation. Somewhere in the 0 to 15 percent band is where good teams sit. This is the number that keeps optimization honest, because halving your build time while doubling failures is a loss.
4. Failed deployment recovery time. How long to restore service. Under 1 hour is the target worth holding, and it is more a function of rollback design than of pipeline speed.
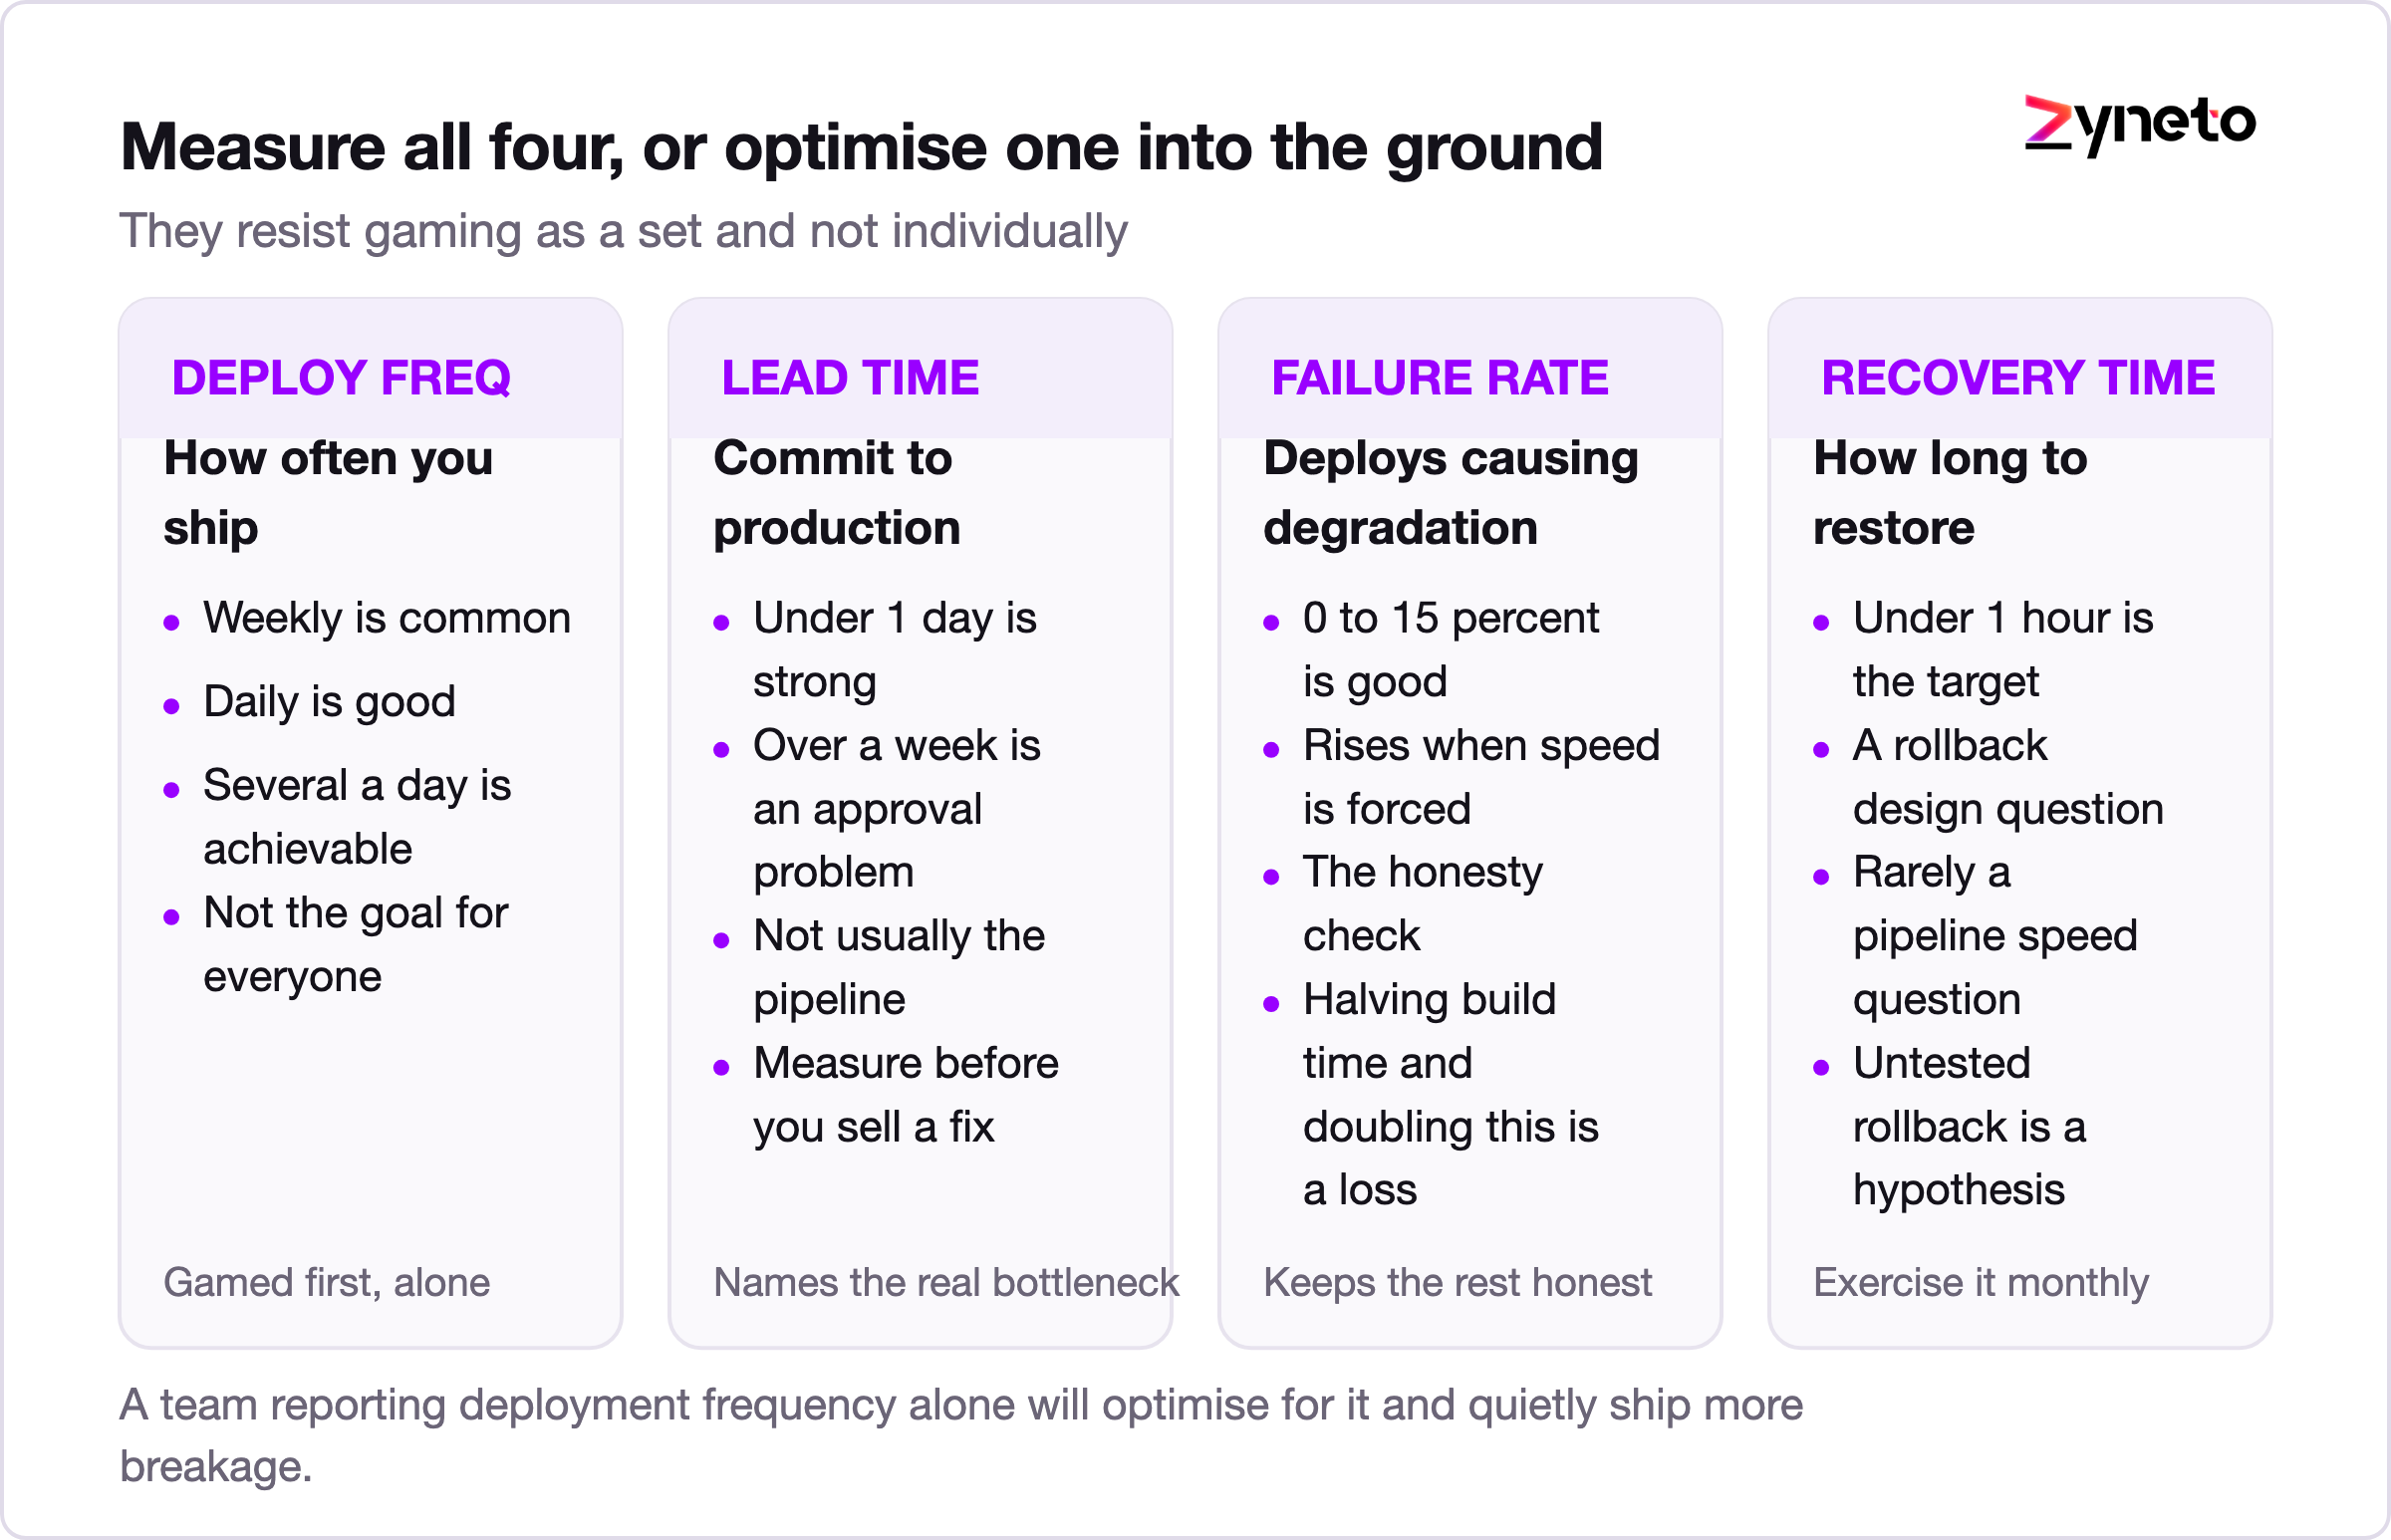
Measure all 4 or none. A team reporting deployment frequency alone will optimise for it and quietly ship more breakage.
Almost every team guesses wrong about their own pipeline, because the slow stage is rarely the one that feels slow. Instrument first, and get a per stage breakdown with timings across at least 50 runs before changing anything.
The distribution we usually find:
|
Stage |
Typical share |
What is really wrong |
|
Dependency install |
15 to 30 percent |
No cache, or a cache key that misses on every run |
|
Test execution |
30 to 50 percent |
Serial execution, no sharding, integration tests running on every commit |
|
Container build |
10 to 25 percent |
Layer order invalidating the cache on every source change |
|
Artifact upload and pull |
5 to 15 percent |
Images built fat instead of multi stage |
|
Waiting for a runner |
5 to 20 percent |
Concurrency limits, invisible until you plot it |
|
Deploy |
5 to 10 percent |
Rarely the problem, frequently blamed |
Cache hit rate is the number worth putting on a dashboard. A dependency cache that hits 95 percent of the time and one that hits 40 percent look identical in the configuration and differ by minutes per run. Most misses come from a key built on something that changes more often than the dependencies do, such as hashing the whole repository rather than the lock file.
Test sharding gives the largest single win in most codebases. Splitting a 20 minute suite across 8 parallel workers does not give 2.5 minutes, because setup and teardown do not shard, but 4 to 6 minutes is normal and it costs a few hours of work.
The intervention with the best ratio of effort to result is usually the smallest: stop running the full integration suite on every commit. Run unit tests and a fast smoke set on push, run the full suite on merge to main, and run the long tail nightly. That is a policy change, not an engineering project.
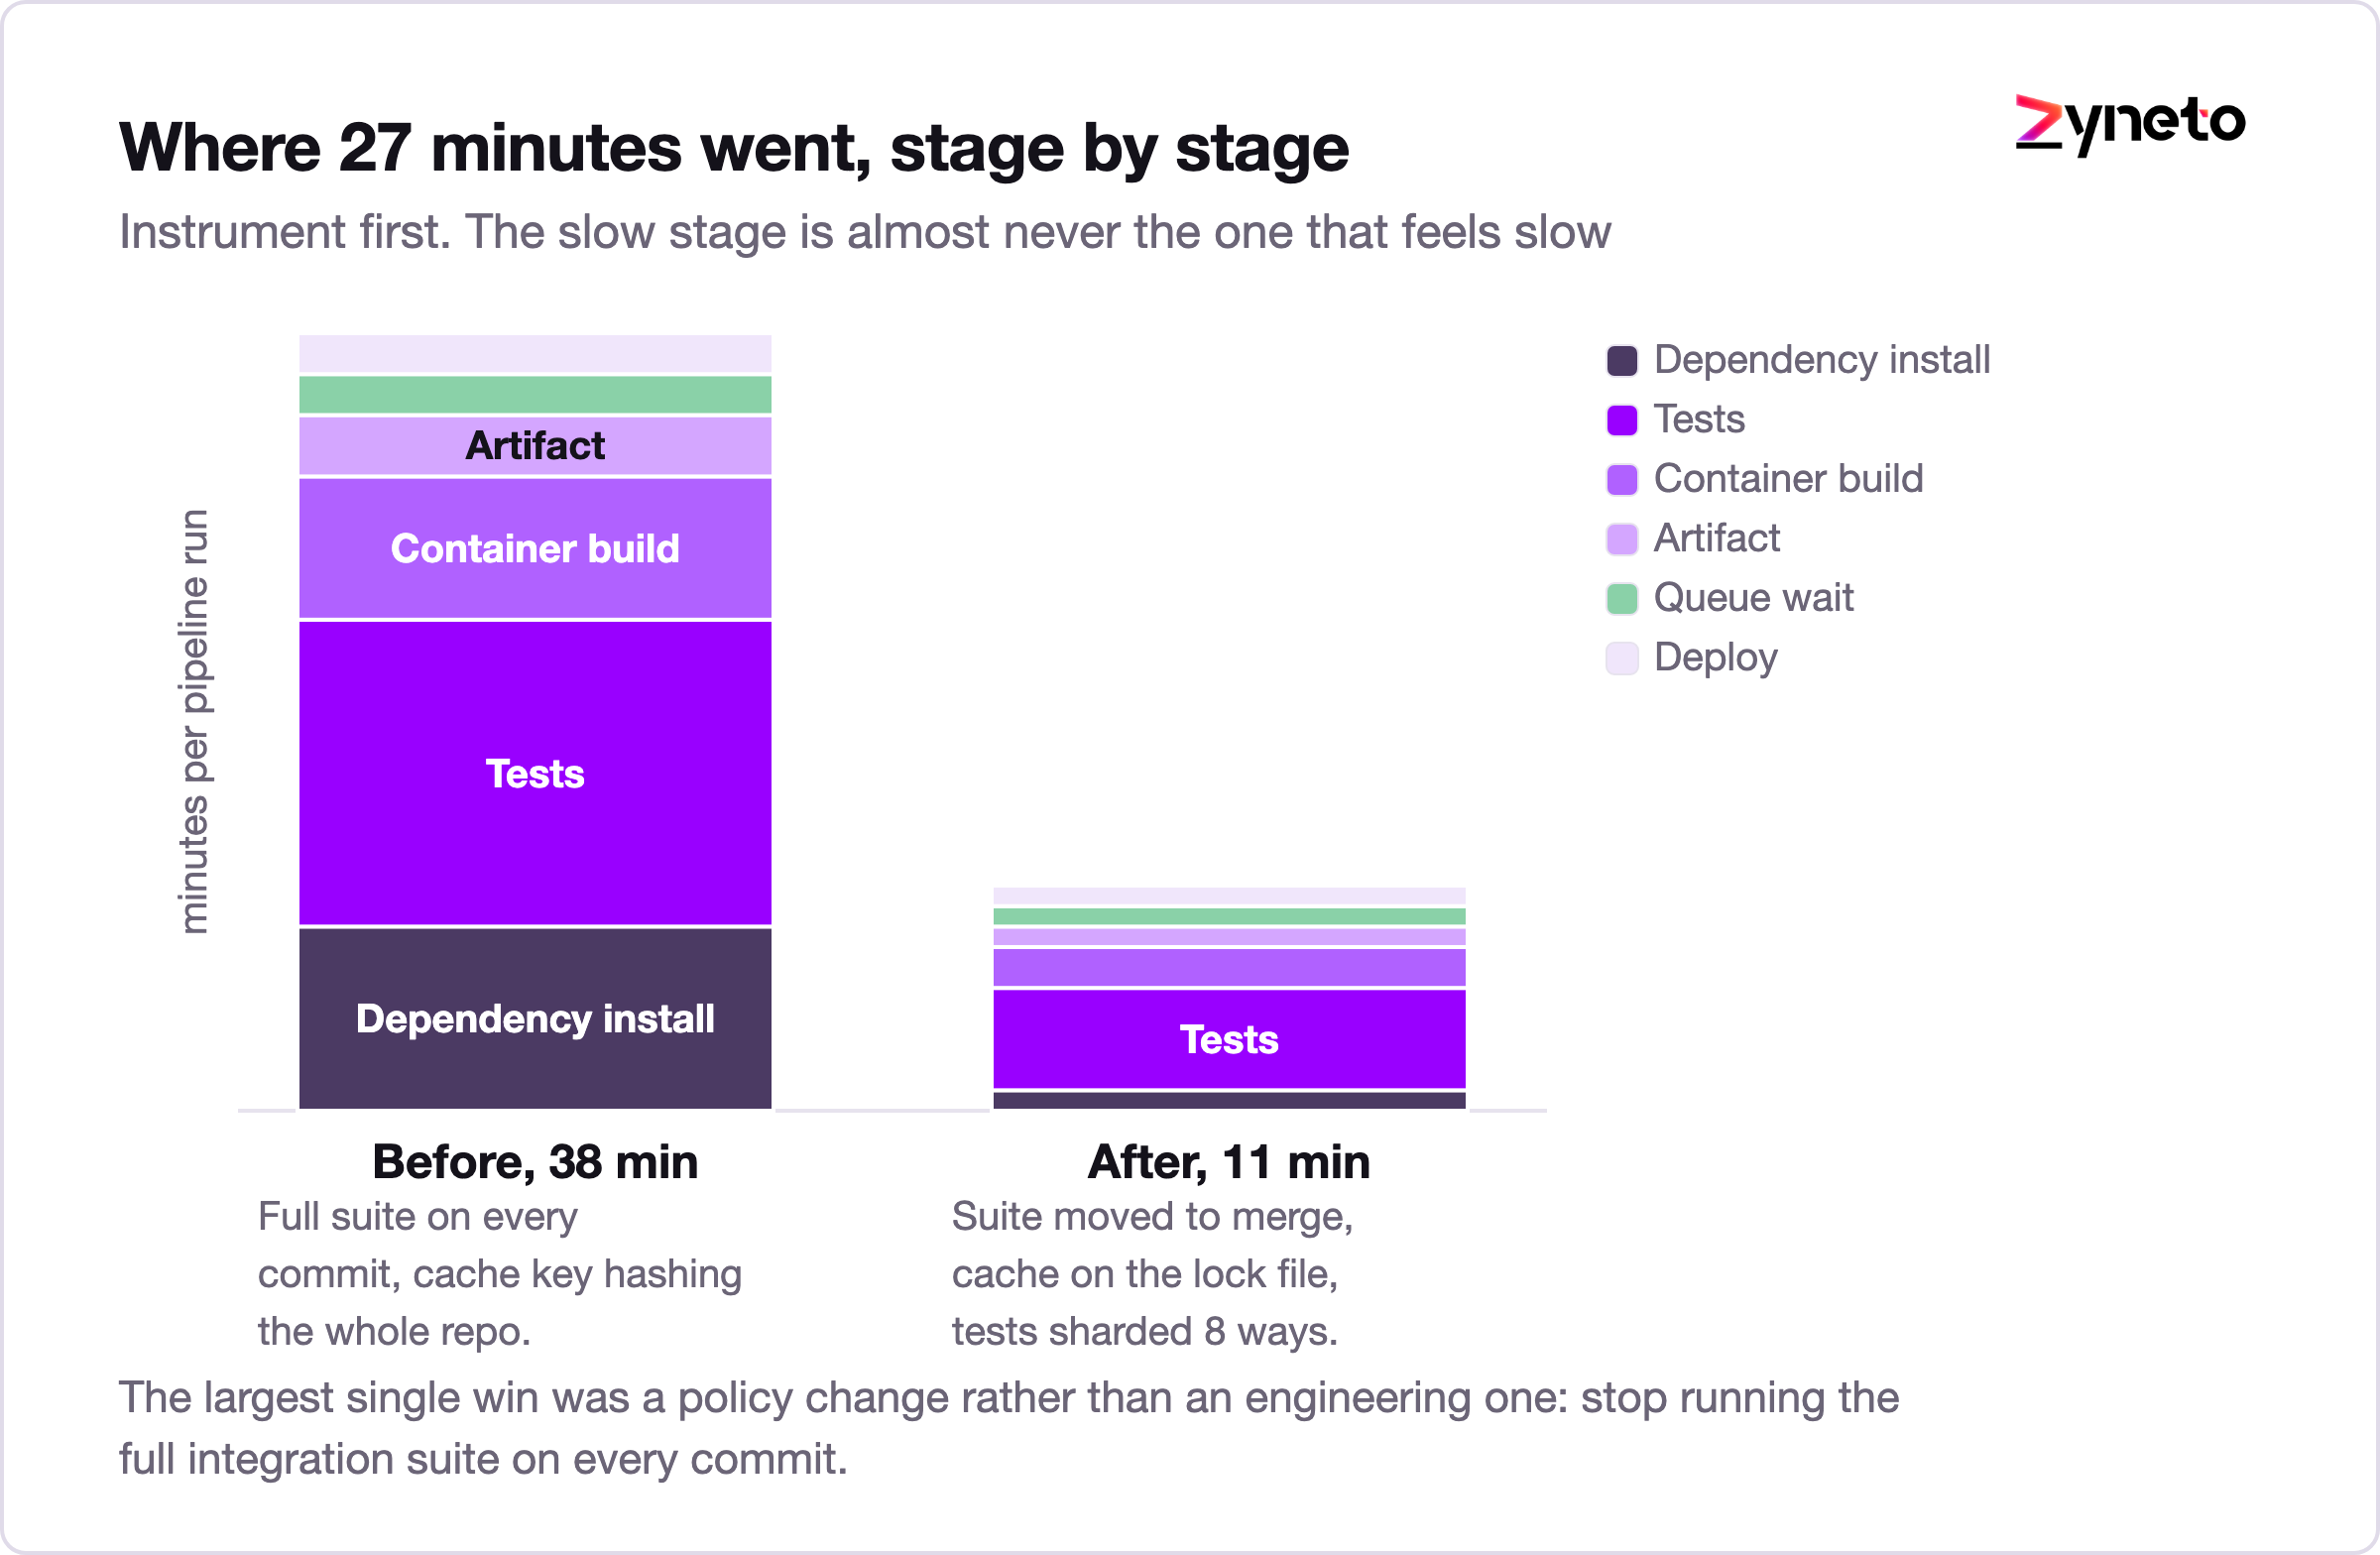
Queue wait deserves a specific mention because it is the stage nobody instruments. A pipeline that takes 12 minutes to run and 9 minutes to start is a 21 minute pipeline as far as the engineer is concerned, and every optimization applied to the 12 will feel like it did nothing. Plot queue wait by hour of day. If it spikes between 10am and noon, the constraint is concurrency, and buying concurrency is one of the few cases where spending money genuinely solves the problem.
A flaky test fails intermittently with no code change. Everyone knows they are bad. Almost nobody has a policy, which is why they accumulate.
The damage is not the failed run. It is that a suite with 5 known flaky tests teaches engineers that a red build might mean nothing, and once that belief exists, real failures get re-run instead of read. A pipeline nobody trusts provides no safety at all while costing exactly as much.
Write the policy down. Track pass rate per test over the last 50 runs. Anything under a threshold, commonly 98 percent, is quarantined automatically: excluded from the blocking suite, still executed, still reported. Quarantine creates a ticket with an owner and an expiry, usually 2 weeks, after which the test is fixed or deleted. Deleting a test that has never caught a real bug is a net gain, and teams are usually far too precious about this.
Cap the quarantine list. If more than about 2 percent of the suite is quarantined, the suite has a design problem and no amount of individual fixes will clear it. The usual root cause is shared mutable state between tests, followed closely by timing assumptions that hold on a developer laptop and fail on a loaded runner.
Optimization has a failure mode where the pipeline gets faster and the system gets less reliable, and it usually arrives through the same 3 shortcuts.
Skipping stages under time pressure. A manual override that lets somebody bypass tests will be used, then used routinely. If it exists, log it, alert on it, and review the log monthly.
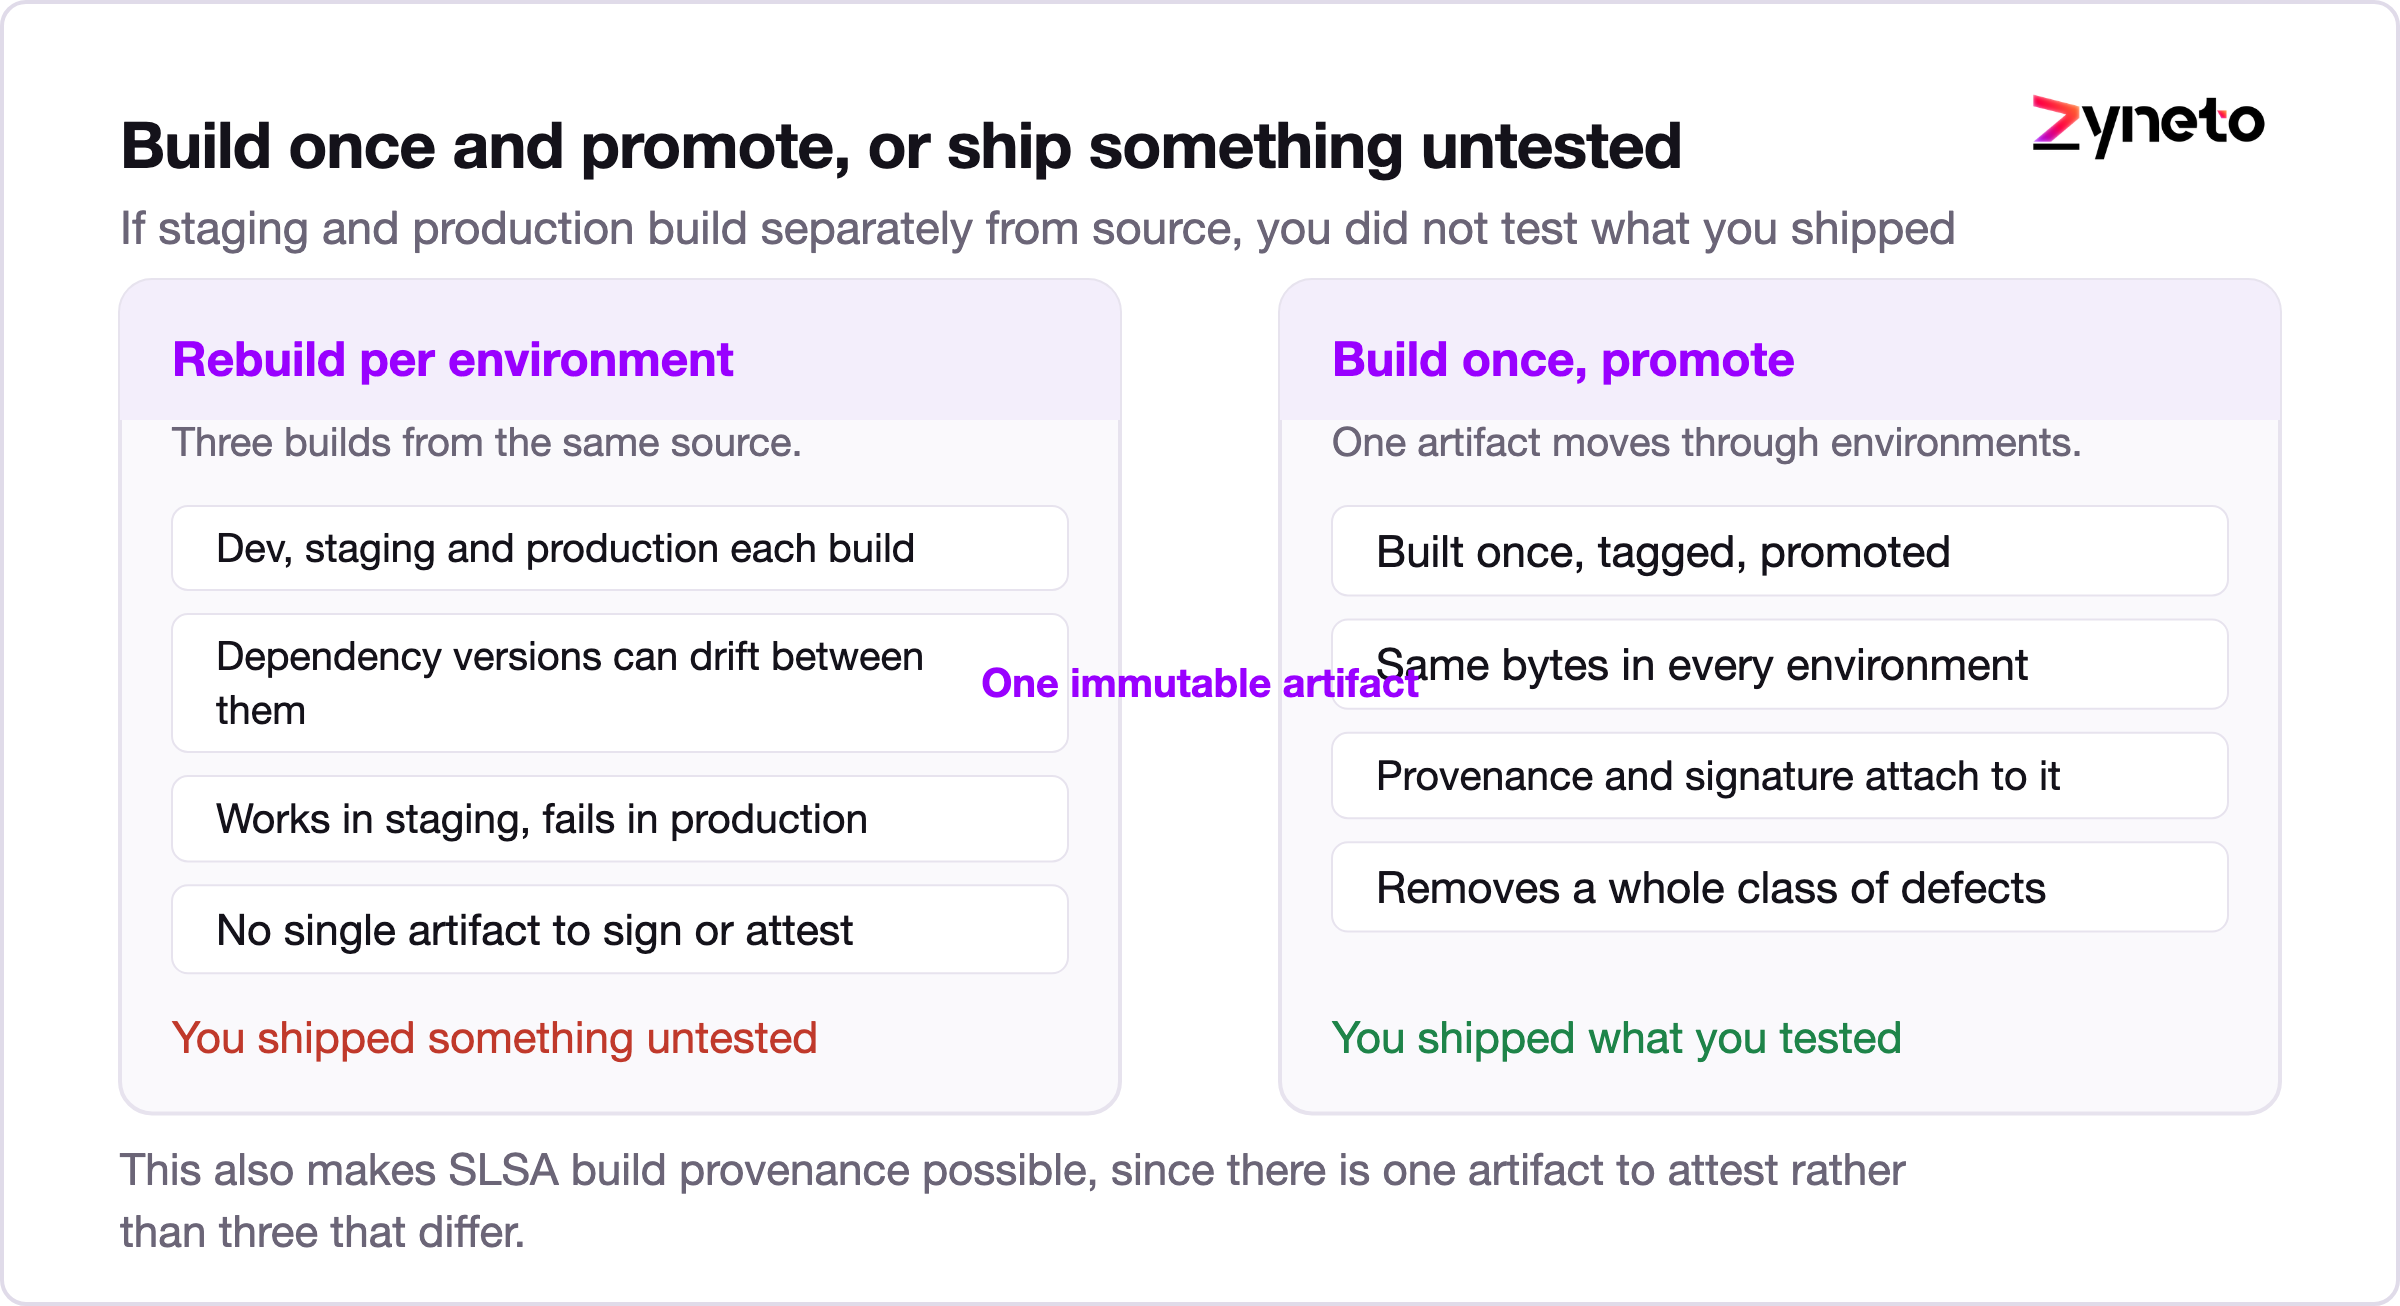
Rebuilding artifacts per environment. If staging and production build separately from source, you did not test what you shipped. Build once, tag it, promote the same immutable artifact through environments. This also removes a whole class of works-in-staging defects.
Deploying everything the same way. A stateless service can go out on a canary at 5 percent for 10 minutes and roll forward. A database migration cannot. Separating schema changes from code deploys, so migrations are backwards compatible and ship ahead of the code that needs them, is what actually lets a team deploy daily without a change advisory board.
Rollback speed deserves its own attention. Most teams can deploy in 4 minutes and roll back in 25, because rollback is untested. A rollback that has not been exercised in the last quarter is a hypothesis.
Exercise it deliberately. Pick a low traffic window once a month, deploy a known good previous version to production on purpose, confirm the time, and write it down. Teams that do this find the surprises early: a configuration value that only exists in the newer release, a queue consumer that cannot read messages written by its successor, a cache schema that changed without a version. Every one of those turns a 4 minute rollback into a 40 minute incident, and every one of them is cheap to fix on a Tuesday afternoon and expensive to discover at 2am.
Feature flags change this arithmetic more than any deployment strategy does. A change shipped dark and enabled by a flag can be disabled in seconds without a deploy at all, which decouples releasing from deploying and takes most of the pressure off rollback speed. The cost is flag hygiene: flags that are never removed become permanent untested branches in the code, so give each one an owner and a removal date at creation.
This section used to be optional and is not any more, because it now arrives through procurement rather than through engineering.
SBOM. A software bill of materials listing every component and version in a build. Two formats matter: SPDX, standardised as ISO/IEC 5962:2021, and CycloneDX, standardised by Ecma as ECMA-424 in 2024. Both are machine readable and both can be generated in the pipeline in minutes. US federal software procurement has required SBOMs since the 2021 executive order on cybersecurity, and enterprise buyers have followed.
Provenance and SLSA. The SLSA framework, version 1.0 published in April 2023, defines build levels describing how trustworthy an artifact's origin is. Build Level 1 asks only that provenance exists. Level 2 requires it to be signed by a hosted build service. Level 3 adds hardened, non falsifiable builds. Level 2 is achievable in most pipelines in under a week.
Signing. Sigstore and cosign made artifact signing free and largely painless. A signed artifact plus recorded provenance answers most of what a security questionnaire asks about your build.
None of this makes the pipeline faster. It makes the pipeline sellable, which matters when a deal is waiting on a security review.
The practical sequencing point: generate the SBOM at build time from the resolved dependency graph, not afterwards from a scan of the running container. The two disagree, and the one that matches what you actually shipped is the one produced by the build.
Being honest about the ceiling is what stops a project overpromising in month one and getting cancelled in month four.
1. Approval latency. If a change waits 3 days for a review board, taking the build from 38 minutes to 8 moves lead time by under 1 percent. Measure where the time sits before selling a pipeline project as a lead time fix, because the answer is frequently organisational and the pipeline is just the visible part.
2. Coupled architecture. A monorepo where any change triggers every test is a dependency graph problem wearing a pipeline costume. Affected-target detection helps and has limits. Modules that genuinely cannot be tested independently will keep costing what they cost until the coupling is addressed, which is a much larger piece of work.
3. Slow tests that are slow for real reasons. Some integration suites are slow because they exercise real databases and real queues, and that is the point of them. Sharding those is fine. Deleting them to hit a build time target trades a visible number for an invisible risk, and the risk turns up later.
4. A test suite that does not test much. Coverage percentage says almost nothing here. A suite that has never failed on a real regression is decoration, and making decoration faster is not an improvement. Ask when the suite last caught something before production did; if nobody can remember, that is the finding.
Published rates, published hours, arithmetic you can argue with.
|
Component |
Hours |
Note |
|
Instrumentation and stage baseline |
30 to 60 |
Do this first, always |
|
Cache strategy and key design |
40 to 90 |
Usually the fastest payback |
|
Test sharding and suite restructuring |
80 to 200 |
Scales with suite size and coupling |
|
Flaky test policy and quarantine tooling |
50 to 110 |
Includes the reporting nobody builds |
|
Build once and promote artifact model |
90 to 180 |
Touches every environment |
|
Progressive delivery, canary and rollback |
120 to 260 |
Includes actually testing rollback |
|
SBOM, provenance and signing |
40 to 90 |
Cheaper than the questionnaire it answers |
At $40 to $100 per hour by role, blending to $60 to $70 for a mixed team, a focused engagement covering instrumentation, caching, sharding and a flaky test policy runs about 200 to 460 hours, so roughly $13,000 to $32,000 at a $65 blend. Against the $51,000 a year of waiting in the opening example, that pays back inside a year on the time saving alone, before counting the failure rate improvement.
Order matters, because optimising an unmeasured pipeline is guessing with extra steps.
Week 1, measure. Per stage timings across 50 or more runs, cache hit rate, queue wait, and the 4 DORA measures with a real baseline. Change nothing.
Week 2, policy. Move the integration suite off every commit, set the flaky quarantine threshold, and cap manual overrides. These cost almost no engineering time and often deliver half the total win.
Weeks 3 to 5, mechanics. Cache keys, test sharding, container layer order, multi stage builds. This is the part everyone starts with and it belongs third.
Weeks 6 to 8, safety. Build once and promote, canary deploys, tested rollback, backwards compatible migrations.
Week 9 onward, supply chain. SBOM generation, provenance, signing. Do it once, then it runs itself.
Put the annual waiting cost on the board before you start and measure against it monthly. A pipeline project without that number gets cut in the first budget review, and a pipeline project with it usually gets extended.
For pull request feedback, aim under 10 minutes, because that is roughly the limit of an engineer's willingness to wait rather than context switch. Merge pipelines can run longer if they are not blocking anyone. What matters more than the absolute number is whether the time is spent on work that could catch a real defect.
Four measures: deployment frequency, lead time for changes, change failure rate, and failed deployment recovery time. Strong teams sit under 1 day of lead time, in the 0 to 15 percent band for change failure rate, and under 1 hour for recovery. Track all 4, because optimising any one alone degrades the others.
With a written policy rather than case by case heroics. Track pass rate per test over the last 50 runs, automatically quarantine anything under about 98 percent so it still runs and reports but no longer blocks, and attach an owner and a 2 week expiry. If more than about 2 percent of the suite is quarantined, the suite itself needs redesigning.
Usually a policy change rather than an engineering one: stop running the full integration suite on every commit. After that, test sharding gives the largest mechanical win, and cache key design is the cheapest. Bigger runners are the most commonly attempted fix and one of the least effective.
A software bill of materials listing every component and version in a build, in either SPDX, standardised as ISO/IEC 5962:2021, or CycloneDX, standardised as ECMA-424 in 2024. It is generated in the pipeline in minutes, and it now arrives as a procurement requirement rather than an engineering preference.
A focused engagement covering instrumentation, caching, test sharding and a flaky test policy runs about 200 to 460 hours, roughly $13,000 to $32,000 at a $65 blended rate. Rates are $40 to $100 per hour by role. Safety work such as progressive delivery and tested rollback adds 120 to 260 hours.
No. Build once, tag the artifact, and promote the same immutable build through environments. Rebuilding per environment means production runs something that was never tested, and it produces most of the defects that only appear after a staging sign off.

Vikas has around fifteen years of experience building software and now builds generative AI systems at Zyneto. His work covers retrieval augmented generation, agentic AI, knowledge graphs, AI memory, and the evaluation and guardrails that decide whether any of it is safe to put in front of customers. He has shipped enterprise copilots, document AI, chatbots and predictive analytics for e-commerce, fintech and marketing teams, and works day to day in Python, JavaScript and SQL. He follows multimodal models, business process automation and enterprise AI security closely, and mentors engineers moving into AI. He writes about architecture, inference cost and the failure modes that only show up at production scale.
Share your details and we will talk soon.
Be the first to access expert strategies, actionable tips, and the trends actually shaping the digital world. No fluff - just practical insights delivered straight to your inbox.
Dive into our blog and stay ahead of the curve with expert perspectives, future-ready trends, and tech tips written for decision-makers and doers alike.