AI Observability: You Cannot Debug What You Did Not Record


A customer tells you the system gave them a wrong answer on Tuesday. Reconstruct what happened.
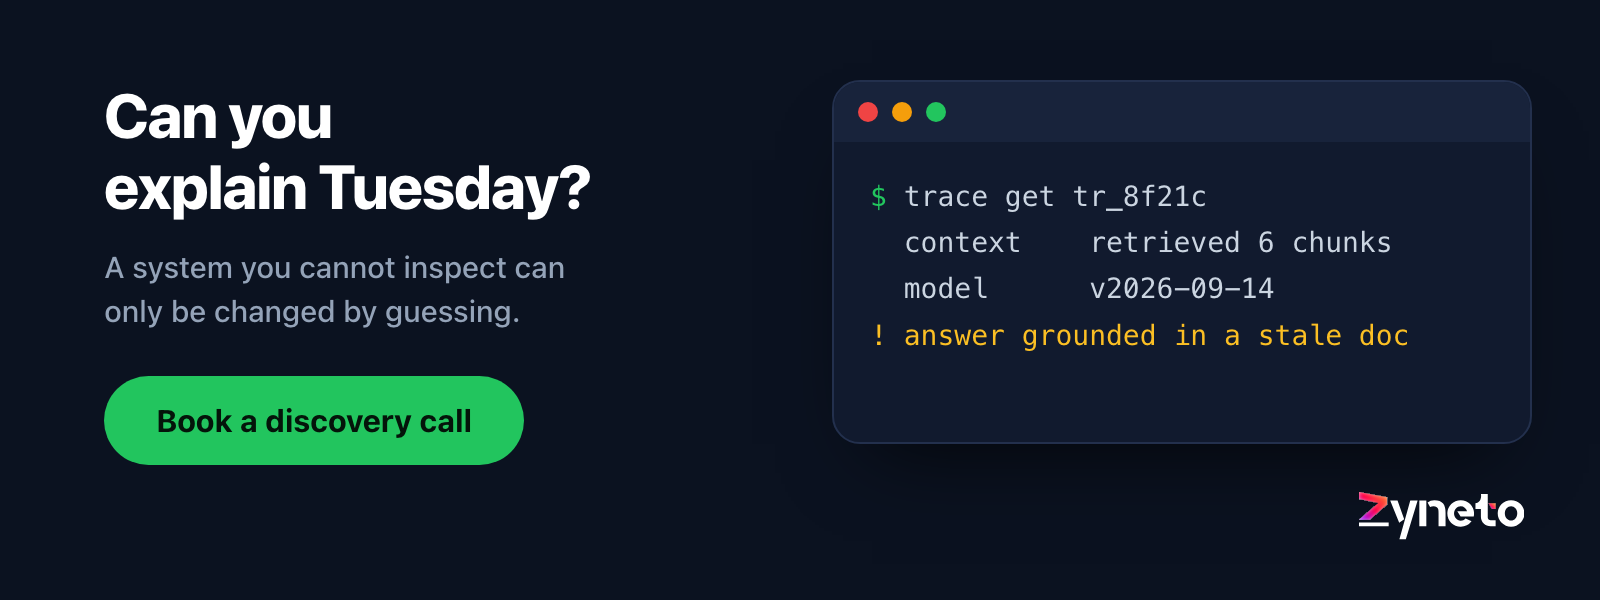
For a conventional service that is a log query. For an AI feature it frequently is not, because the thing that determined the output was the assembled context, and almost nobody stores it. The request and the response are logged. What sat between them is gone: the retrieved documents, the resolved prompt, the conversation history, the tool results, the model version.
Without that, every investigation ends in a shrug, and the team's answer to a quality complaint becomes "we changed the prompt and it seems better", which is not engineering.
AI systems are non-deterministic, which changes what logging has to do. The same input can produce different output, so you cannot reproduce a failure by replaying the request. The only reliable record is the one captured at the time, which means observability is not a debugging tool you add when there is a problem. It is the thing that makes the problem investigable at all.
Three things make the difference. Store the resolved context, not the template. Trace the whole operation rather than each call. And attribute cost and latency per feature, because that is the question finance asks and nobody can answer.
A trace is the unit, not a request
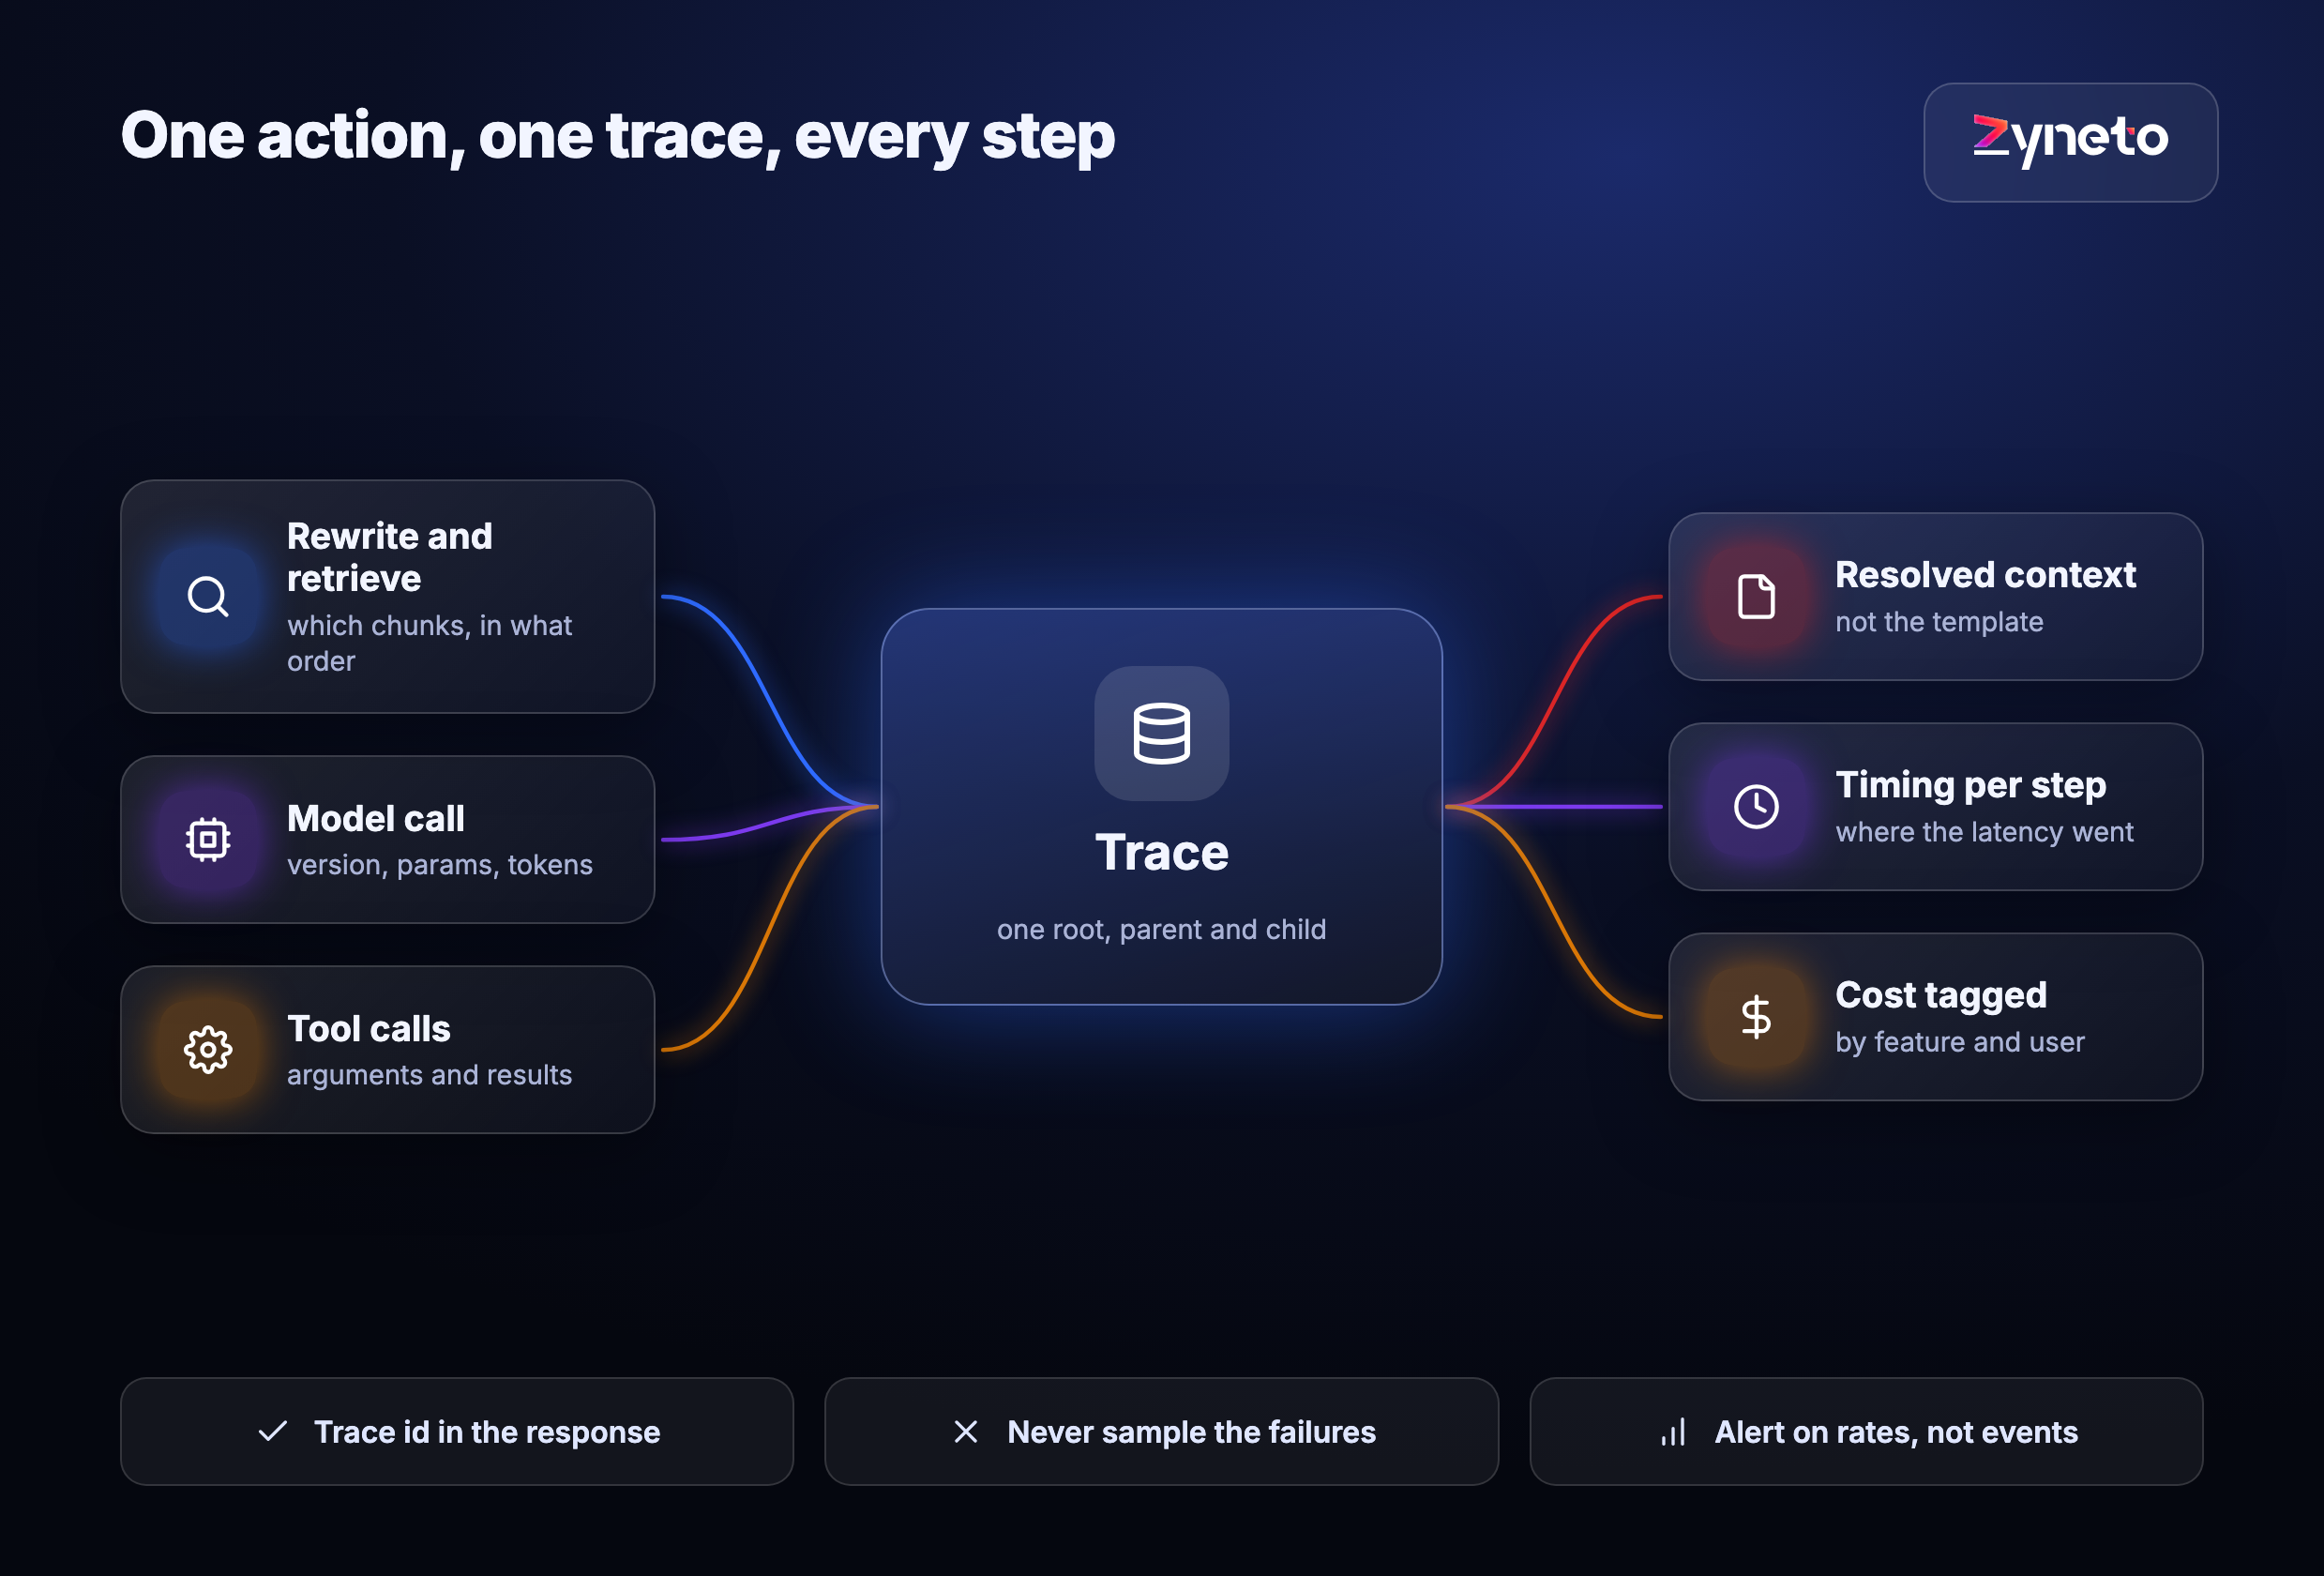
The unit of AI observability is a trace, not a request. One user action can be a dozen model calls: a query rewrite, an embedding, a retrieval, a rerank, a generation, two tool calls. A trace ties them to one root with parent-child structure, so you can see which retrieval fed which generation.
Conventional logging records calls. An AI operation is a tree of calls and the shape of the tree is what you need.
One user action can be a dozen model invocations. A query rewrite, an embedding, a retrieval, a rerank, a generation, two tool calls, a summarisation. Logging each in isolation gives you twelve rows and no way to know they belonged together.
A trace ties them to one root. Every step carries the trace identifier, so the whole operation can be reconstructed in order, with timings, inputs and outputs at each stage.
The parent-child structure matters as much as the list. Which retrieval fed which generation, which tool call the model made in response to which result. A flat list of steps loses the causality that explains the outcome.
Instrument at the boundary of each component, not inside the model client. Retrieval, reranking, generation and each tool are the units you will reason about, and timing them separately is what lets you say where the latency went.
Record the decision, not only the result. For an agent, which tools were available at that moment matters as much as which was called, because a tool missing from the list explains a failure that otherwise looks like poor reasoning. Capture the offered set alongside the chosen one.
Propagate the trace identifier to the user-visible layer. When somebody reports a problem, "give me the reference from the bottom of the response" turns a day of searching into a lookup. This is a small feature with an outsized payoff.
Store the resolved context, not the template
This is the single highest-value thing in this post and the one most often missed.
Logging the prompt template tells you nothing. The template is in your repository. What you need is what the model actually received after variables were substituted, documents were inserted and history was assembled.
For retrieval systems, store which chunks were retrieved and in what order. When an answer is wrong, the first question is whether the right evidence was present, and that question is unanswerable without this.
Store the model version and every parameter. Temperature, max tokens, the model identifier including any version suffix. Providers update models, and "it worked last month" with no record of which model it worked on is not a reproducible claim.
Store tool call arguments and results. For an agent, the sequence of tool calls is the behaviour, and the result each returned is what the model reasoned over next.
Store the version of your own code too. A prompt change, a retrieval parameter, a reranking threshold: all of these are deployments, and correlating a quality shift with the release that caused it needs the release recorded in the trace rather than inferred from timestamps.
This has a storage cost and a privacy consequence, both of which need a decision rather than a default. Contexts are large, so retention is a real bill. And the stored context contains whatever the user and your corpus put in it, which means the same handling obligations as any other copy of that data: redaction at capture, access control on the store, and a retention period someone has agreed.
What should you measure in an AI system?
The useful signals divide into three groups and only one requires a judge.
The three groups of signal
- Operational signals come free from the trace. Latency per step and end to end, token counts in and out, cached token proportion, error and retry rates, tool failure rates, and step counts per operation. These catch most regressions and cost nothing to compute.
- Behavioural signals come from the user and are the most honest. Did they rephrase immediately, which is the clearest free indicator of a bad answer. Did they abandon. Did they escalate to a human. Did they copy the output, which suggests it was useful. None of these needs a model to evaluate and all of them track real quality.
- Quality signals need a judge and should be sampled, not universal. Grading every response with a model doubles your inference bill to measure something you can estimate from a sample. Score a percentage and read it weekly.
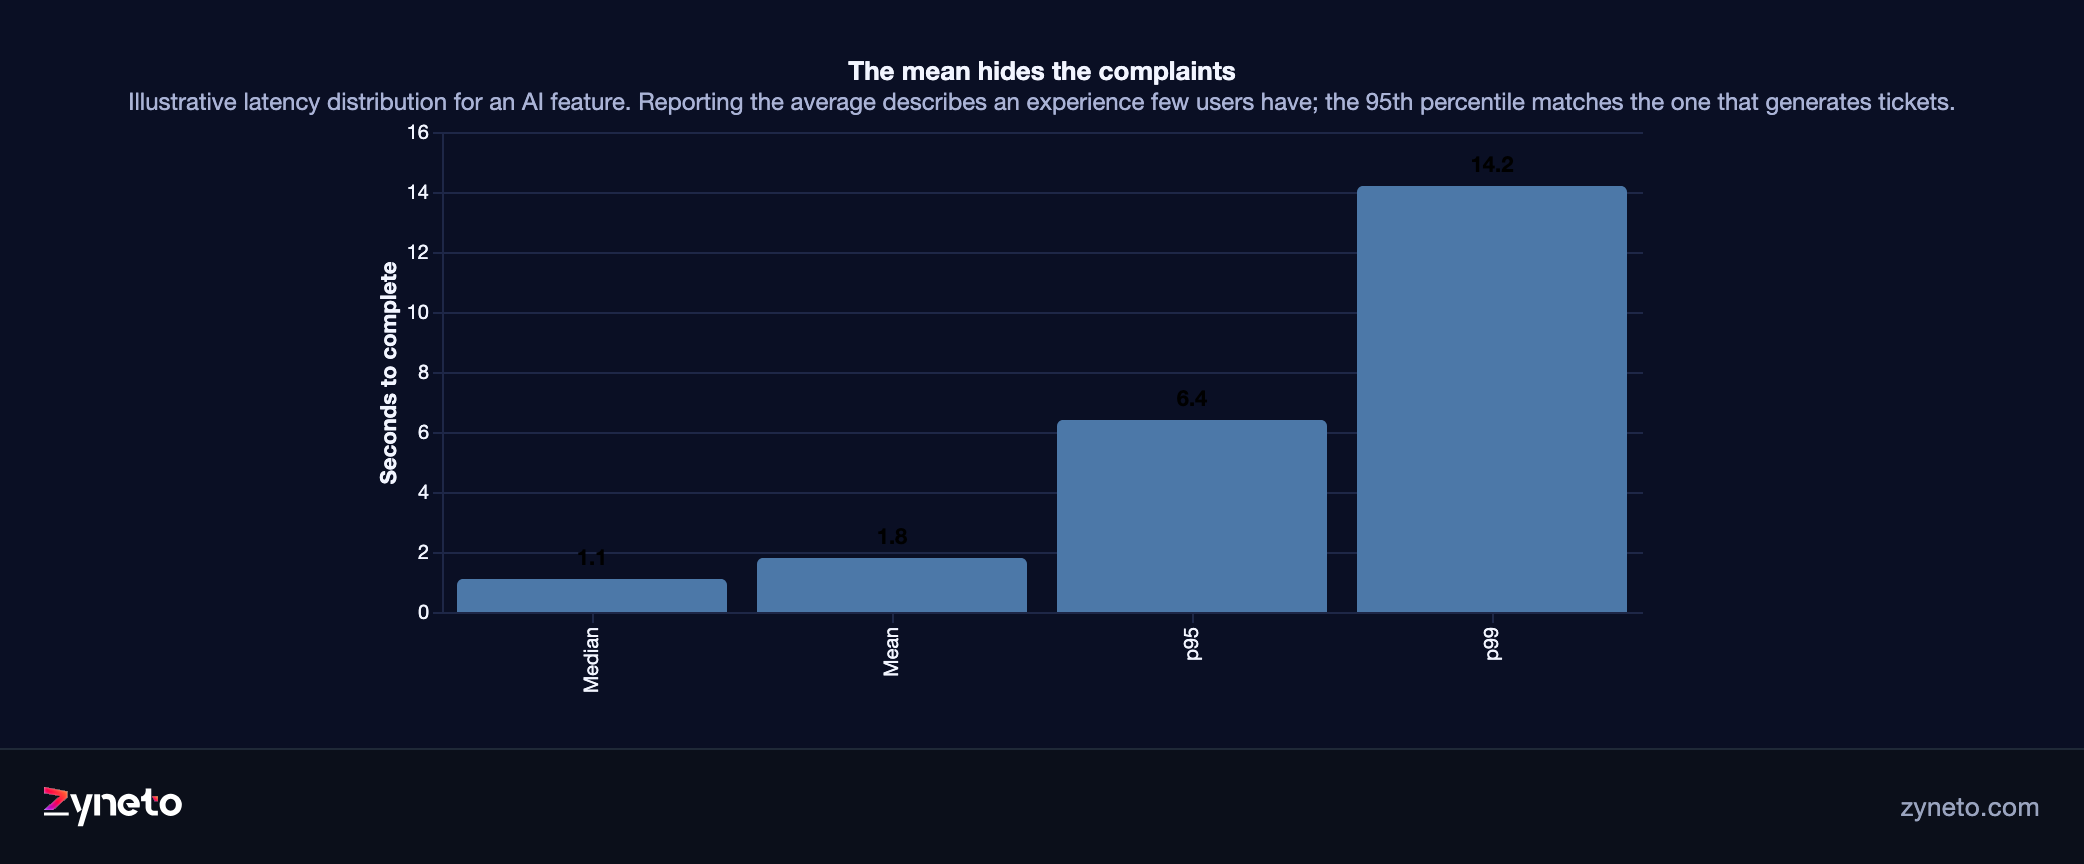
Watch distributions rather than averages. AI latency and cost are long-tailed, and the mean hides exactly the cases that generate complaints. The 95th percentile is the number that matches user experience.
Separate a model failing from a model being unavailable. Provider errors, rate limits and timeouts are infrastructure problems with infrastructure fixes, and mixing them into a quality metric produces a dashboard that blames the prompt for an outage.
Alert on rates, not on events. Individual failures are expected in these systems, so per-error alerts get muted within a week. A weekly refusal rate crossing a threshold is a signal somebody will act on.
Sampling, because recording everything is a bill
Full-fidelity capture of every operation is the right default until volume makes it expensive, and then the question is what to keep.
Keep metrics for everything and contexts for a sample. Token counts, timings and outcomes are small and aggregate well. Resolved contexts are large and are what the storage bill is made of, so the sensible shape is universal metrics with sampled detail.
Always keep the failures. Sample successes if you must; never sample errors, refusals, escalations or anything a user flagged. These are rare and they are the only ones anyone will want to read.
Sample by trace, not by span. Keeping a random half of the steps in an operation produces traces that cannot be read, which is worse than not keeping them.
Let the sampling rate be configurable without a deploy. When something is going wrong, the first thing you want is more detail, and waiting for a release to get it is the wrong time to discover the rate was hard-coded.
Keep a higher rate for new features. A feature in its first month deserves full capture; one that has been stable for a year does not.
The feedback loop that makes this worth building
Observability that nobody reads is a cost. The value appears when traces feed something.
Every production failure should become an evaluation case. A user complains, you open the trace, you see what the model received, and that case joins the set that runs before the next deployment. This is the mechanism by which a system stops repeating mistakes, and it only exists if the trace is readable.
Connect the evaluation run to the traces it produced. When a case fails in the suite, being able to open its trace and see the context turns a red test into a diagnosis.
Review a sample on a schedule with a person who understands the domain. Not an engineer checking it ran, but somebody who can tell whether the answer was actually good. An hour a week catches categories of problem no metric is watching for.
Close the loop with the people who reported problems. A trace identifier in the response means support can attach it to a ticket, which means the engineering team gets a reproducible case rather than a description.
Measure whether the loop is working, by tracking how many production failures became test cases. If that number is zero, the observability is decoration.
Cost attribution is an observability problem
Finance will eventually ask where the money went, and the provider invoice cannot answer.
Tag every call with the feature and the user. Without that, you have one number for the month and no way to act on it. With it, you discover that one feature serving a small fraction of users is most of the bill, which is a product decision rather than an engineering one.
Track cost per completed operation, not per call. One user action can be a dozen calls, and per-call cost makes an expensive feature look cheap right up to the invoice.
Separate retries and failures in the accounting. A failed operation that retried three times cost four times as much and produced nothing. If that is invisible, a reliability problem looks like a usage increase.
Watch the ratio of input to output tokens, since output is priced several times higher. A change that makes responses longer is a cost change, and it should be visible in a diff rather than discovered in a bill.
Show engineers the cost of their own change. A per-request cost figure visible in a pull request, or a weekly digest of which feature moved, turns cost from a finance conversation into an engineering one. Teams optimise what they can see.
Set a budget alert with a human owner. Unsophisticated, and it catches the failure modes that nothing else does: a loop, a scraper, a background job that scaled with your data.
Why does an AI system get worse without a deploy?
Conventional software changes when you change it. AI systems change underneath you, and observability is how you notice.
The provider updates the model. Behaviour shifts, sometimes subtly, without any action on your side. If you are not recording the model version per call, you cannot correlate a quality change with the date it moved.
Your data changes shape. The corpus grows, new document types appear, the proportion of one customer segment rises. The system was tuned for yesterday's distribution.
Users learn and change how they ask. Early users phrase things cautiously; experienced ones issue terse commands. The input distribution six months in is not the one you built against.
The world changes and your content does not. A policy updates, a product is renamed, and the corpus keeps confidently answering from the old version.
Keep a fixed set of canary inputs and run them daily. Twenty representative requests, same every day, scored and recorded. When a provider changes something, this is the cheapest detector available and the only one that gives you a date.
Snapshot your key metrics weekly and keep the history. Drift is invisible day to day and obvious over a month, and without the history you cannot tell whether today is normal.
Privacy, because traces contain everything
A trace store is a copy of the most sensitive data flowing through your product, and it is usually created without the scrutiny the primary store received.
Decide what to redact at capture time. Identifiers, payment details, health information, whatever categories apply to you. Capturing and promising to redact later means the raw data existed, which is what matters legally.
Access control the trace store like production data, because it is. Engineers debugging a failure are reading real customer conversations, and that should be deliberate and logged rather than incidental.
Set a retention period and enforce it. Traces are large and accumulate quickly, and an indefinite store is both a cost and a liability. Shorter for full contexts, longer for aggregated metrics, is the usual shape.
Erasure requests reach the trace store. If someone asks to be deleted, their conversations in your observability platform are part of that. Being able to find and remove them needs the user identifier attached to the trace, which is also why you attached it.
Decide what engineers may see by default. Full contexts on every trace is convenient and broad; redacted by default with an audited unmask for investigation is slower and defensible. The second is the right starting position for anything carrying personal data.
Third-party observability platforms are processors. Sending contexts to a vendor is a data transfer with the usual questions about location, retention and training. Ask them before the integration, not after.
Should you build or buy AI observability?
The tooling in this space matured quickly and the build-versus-buy answer is unusually clear.
Buy the trace capture, storage and browsing. Several mature platforms do this well, the integration is typically small, and building a tree-structured trace viewer is a product in itself rather than a feature of yours.
Own the instrumentation decisions. What counts as a span, which attributes are attached, what is redacted and how cost is tagged. These encode your domain and no vendor supplies them.
Own the evaluation set and the assertions, for the same reason, and connect them to the traces so a failing case can be opened and read.
Beware lock-in through the trace format. Using an open tracing standard where possible keeps the option of moving, and these platforms are young enough that you may want to.
Do not wait for the platform decision to start recording. The contexts you fail to capture this month cannot be recovered next month, and the format you capture them in is easier to change than the data you never had.
The pragmatic smallest version is structured logging of the resolved context, the model version, the trace identifier and the per-step timings, into whatever you already run. That is a day of work, it covers most of the value, and it can be migrated to a platform later.
What we would instrument on day one
The minimum useful instrumentation
- The trace identifier, propagated to the user-visible response. Cheapest high-value feature here.
- The resolved context, the retrieved chunks and the model version, for every call. Everything else can be derived; this cannot be reconstructed.
- Per-step timing and token counts, tagged with feature and user.
- Tool call arguments, results and outcomes, where there are tools.
- Three behavioural signals: immediate rephrase, abandonment, escalation to a human. They need no judge and they track real quality better than any score.
Our rate band is published: $40 to $100 an hour by role, blending to $60 to $70 for a mixed team, and the minimum useful instrumentation is a day or two rather than a project. The reason to do it before you need it is that the failure you most want to investigate will be the one that happened before you started recording.
FAQs
Recording enough about each AI operation to explain any individual outcome afterwards. For conventional software a request and response log is usually sufficient. For AI features the thing that determined the output is the assembled context, meaning the resolved prompt, retrieved documents, conversation history, tool results and model version, and if that is not stored, failures cannot be investigated. Because these systems are non-deterministic, you cannot reproduce a failure by replaying the request.
The resolved context rather than the prompt template, since the template is already in your repository. Which chunks were retrieved and in what order. The model identifier including version, plus temperature and token limits. Tool call arguments and their results. Per-step timings and token counts, tagged with the feature and user. And a trace identifier tying the whole operation together, surfaced in the user-visible response so a complaint becomes a lookup.
A trace ties every step of one user action to a single root, with parent-child structure preserved. A single action may be a dozen model calls covering query rewrite, embedding, retrieval, rerank, generation and tool calls, and logging each in isolation gives you rows with no way to know they belonged together. The causality is what explains the outcome: which retrieval fed which generation, which tool result prompted which next call.
Three groups. Operational signals come free from traces: latency per step, token counts, cache hit proportion, error and retry rates, step counts. Behavioural signals come from users and are the most honest: immediate rephrasing, abandonment, escalation to a human, copying the output. Quality signals need a model as judge and should be sampled rather than applied to every response, which would double your inference bill to measure something a sample estimates.
Tag every call with the feature and the user at the point it is made. Without tagging you have one monthly number and nothing to act on; with it, the usual discovery is that one feature serving a small fraction of users accounts for most of the spend. Track cost per completed operation rather than per call, since one action can be a dozen calls, and account for retries separately so a reliability problem does not look like a usage increase.
Four kinds of drift. The provider updates the model and behaviour shifts without any change on your side, which is why the model version belongs in every log line. Your data changes shape as the corpus grows and the user mix moves. Users learn and phrase requests differently than they did at launch. And the world changes while your content does not, so the system answers confidently from outdated material. Weekly metric snapshots with history are how you notice.
Buy the trace capture, storage and browsing, since mature platforms exist, integration is small, and a tree-structured trace viewer is a product rather than a feature of yours. Own the instrumentation decisions, meaning what counts as a span, which attributes attach, what gets redacted and how cost is tagged, because they encode your domain. Prefer an open tracing format to keep the option of moving. The smallest useful version is structured logging into what you already run, which is a day of work.

Vikas Choudhary
Vikas has around fifteen years of experience building software and now builds generative AI systems at Zyneto. His work covers retrieval augmented generation, agentic AI, knowledge graphs, AI memory, and the evaluation and guardrails that decide whether any of it is safe to put in front of customers. He has shipped enterprise copilots, document AI, chatbots and predictive analytics for e-commerce, fintech and marketing teams, and works day to day in Python, JavaScript and SQL. He follows multimodal models, business process automation and enterprise AI security closely, and mentors engineers moving into AI. He writes about architecture, inference cost and the failure modes that only show up at production scale.
Let's make the next big thing together!
Share your details and we will talk soon.